Greek Ancestry in the United States, 1980–2024
Between 1980 and 2024, the number of people reporting Greek ancestry in the United States changed in both overall size and regional distribution. Drawing on decennial U.S. Census data (1980–2010) and the 2024 American Community Survey (ACS) 5-year estimates, this brief presents national totals and compares how the share of the Greek-ancestry population shifted across states and Census regions. The data show growth from 1980 through 2010, followed by a modest decline by 2024, alongside measurable changes in regional concentration.
Key takeaways
Nationally, the Greek‑ancestry population increased from about 959,856 (1980) to about 1,337,511 (2010), then declined to about 1,203,356 in 2024.
In 2024, Greek Americans remain concentrated in a small set of large states (especially New York, California, Florida, Illinois, and Massachusetts), even as the population is widely dispersed nationwide.
From 1980 to 2024, state shares shifted slightly away from some older Northeastern/Midwestern hubs and toward parts of the South and West - more a gradual redistribution than a wholesale relocation.
Data and definition
Greek ancestry is self‑reported in the census/ACS ancestry question. For comparability across years, the counts here reflect an “any‑mention” concept: people who reported Greek ancestry, alone or in combination with another ancestry.
For 1980–2010, totals come from NHGIS ancestry tabulations; for 2024, totals come from the ACS 2024 5‑year ancestry question.
Because question wording, coding, and sampling vary across data products, small year‑to‑year differences should be interpreted cautiously, especially for smaller states.
1. National trend, 1980–2024
The national Greek‑ancestry population increased from 1980 through 2010, rising by about 39% (959,856 to 1,337,511). Since 2010, the total has declined by roughly 10%, to about 1,203,356 in the 2024 ACS 5‑year estimates. Overall, the long‑run pattern is three decades of growth followed by a more recent period of moderate decline (See Figure 1 below).
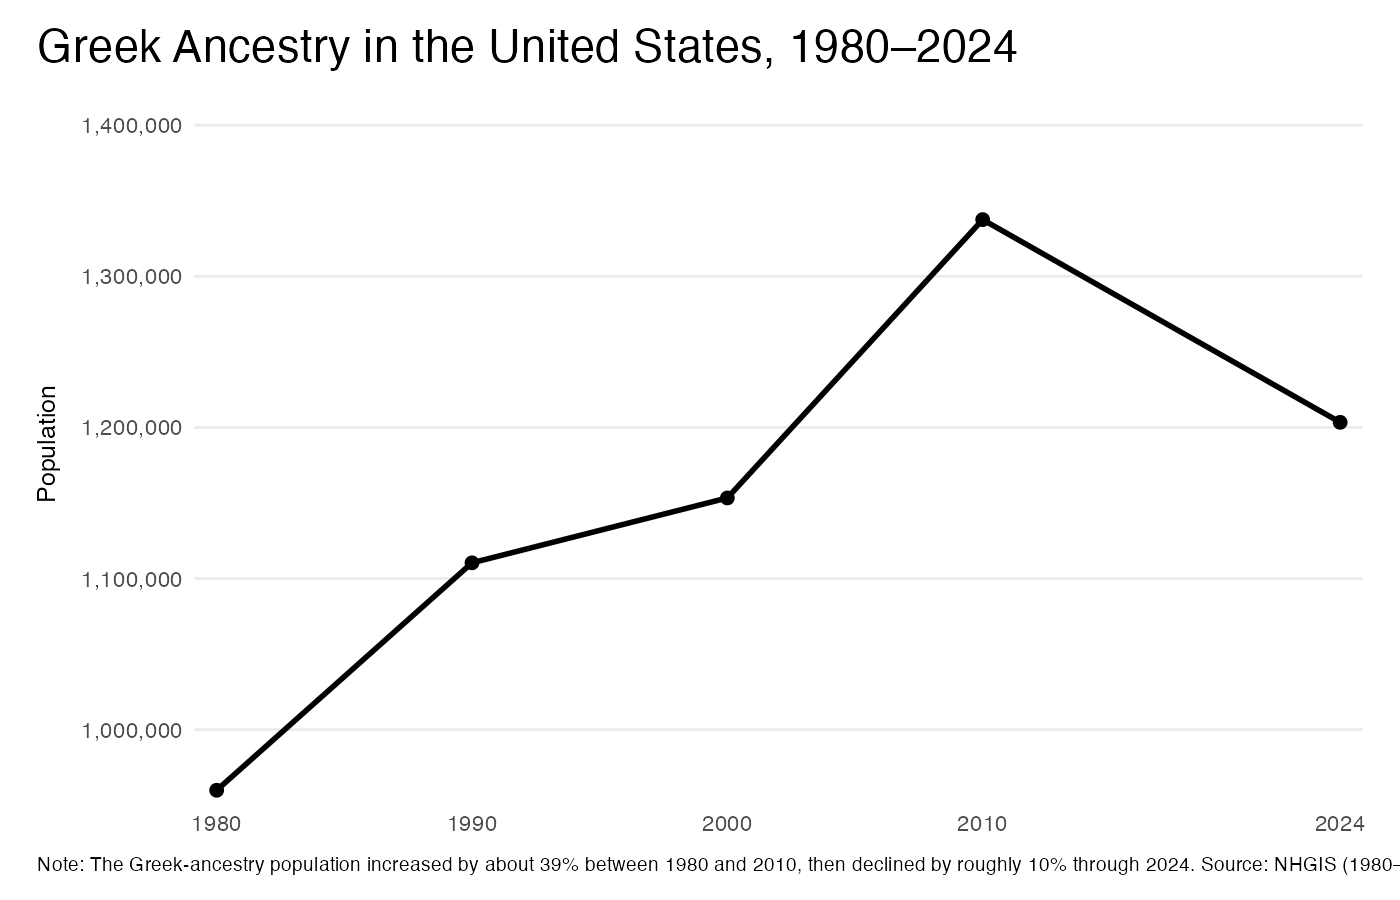
Figure 1. Greek ancestry in the United States, 1980–2024 (total population; sum across states and DC).
2. Where Greek Americans live today
In 2024, Greek Americans are concentrated in a handful of states. The largest shares are in New York (11.4%), California (10.0%), Florida (7.6%), Illinois (7.0%), and Massachusetts (5.8%).
Together, these states account for a substantial portion of the U.S. Greek‑ancestry population, reflecting long‑standing settlement patterns and the continued role of major metropolitan areas.
Beyond the top tier, many states each account for only 1–3% of the national total, underscoring how geographically dispersed Greek Americans are today (See Figure 2 below).
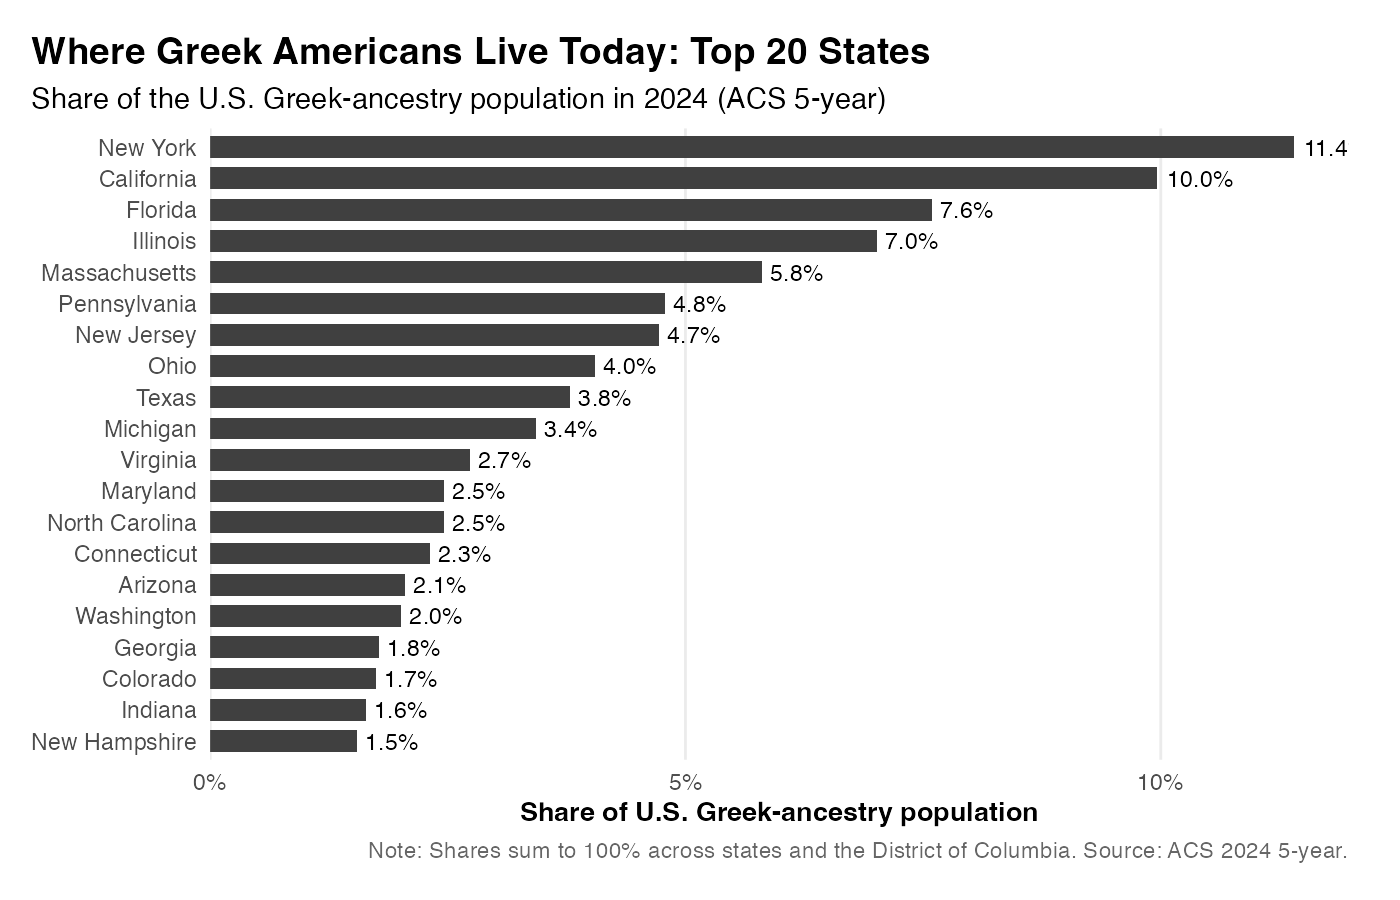
Figure 2. Where Greek Americans live today: Top 20 states by share of the U.S. Greek‑ancestry population (2024).
3. How the geography has changed since 1980
Between 1980 and 2024, the Greek‑ancestry population redistributed modestly across states.
Some historically dominant states saw their share of the national total decline, even when their absolute counts remained stable or rose slightly, because growth was faster elsewhere. In contrast, several states in the South and West increased their share, consistent with broader U.S. population shifts and internal migration (See Figures 3 & 4 below).
The overall picture is incremental change: older hubs remain important, but the center of gravity has moved somewhat toward southern and western states (See Figure 5 below).
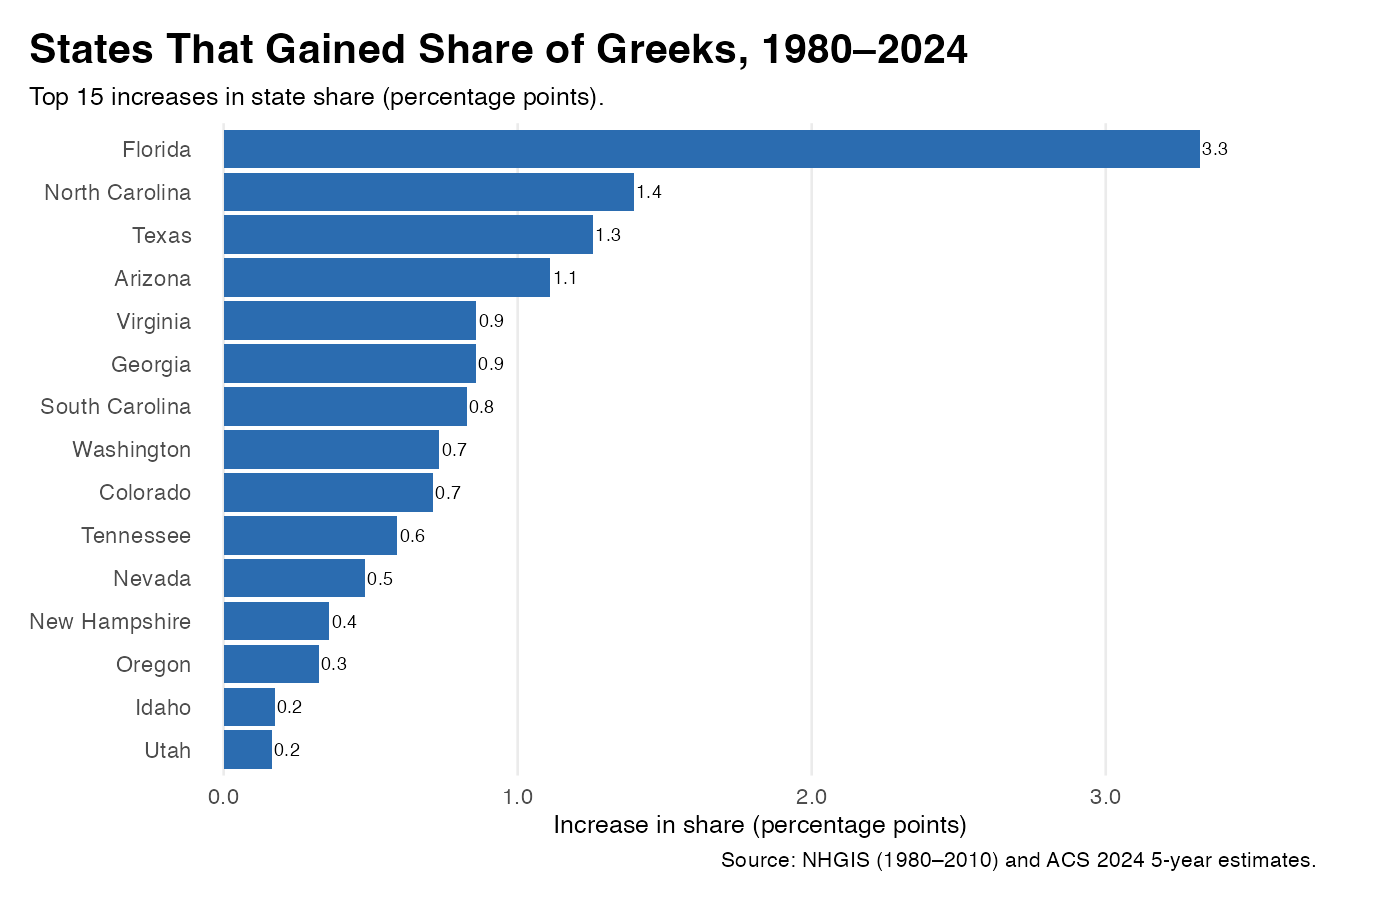
Figure 3. States that gained share of the U.S. Greek‑ancestry population, 1980–2024 (percentage‑point change).
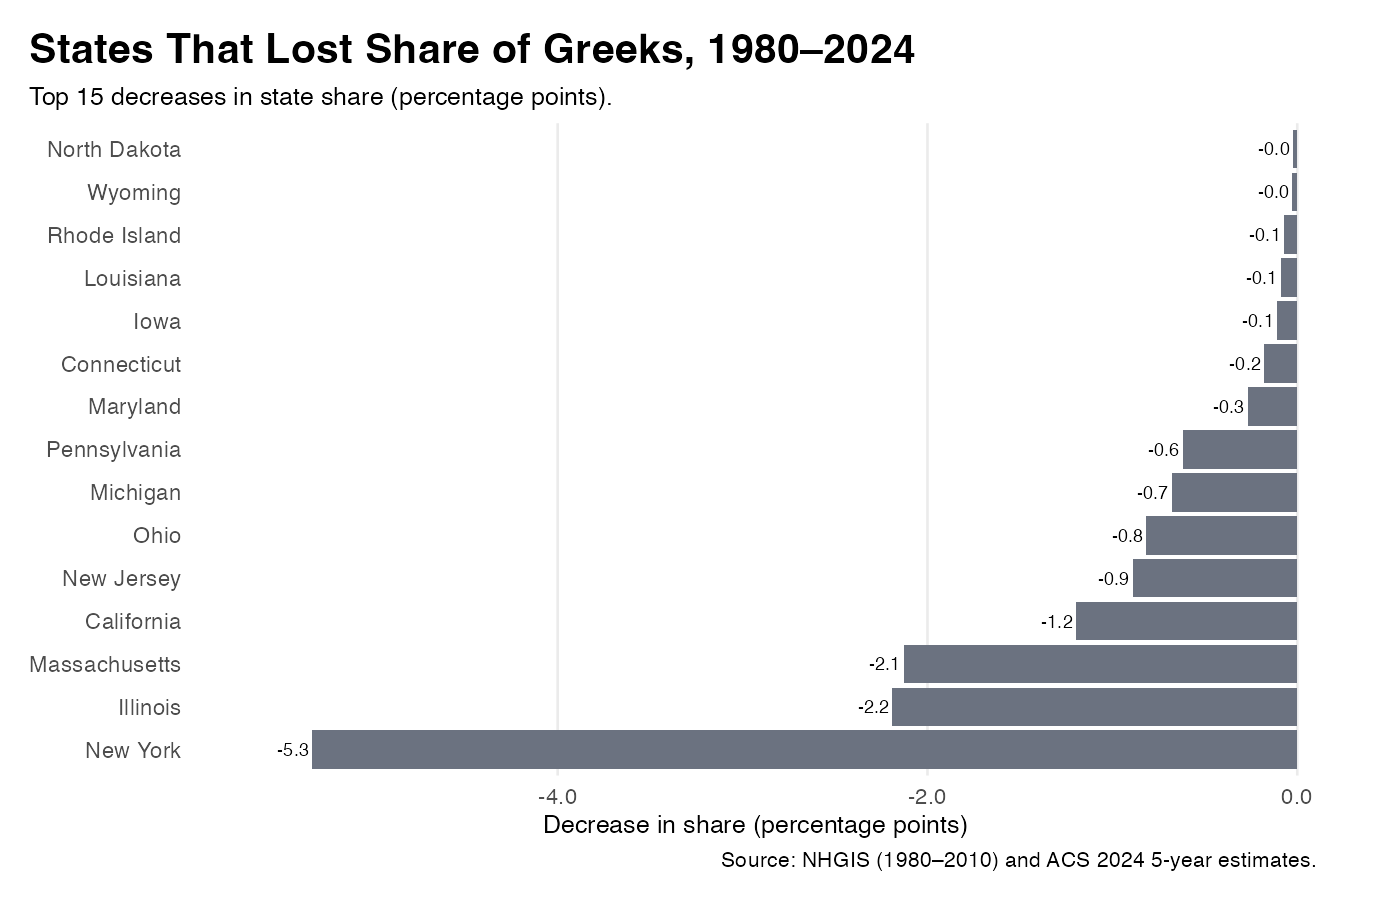
Figure 4. States that lost share of the U.S. Greek‑ancestry population, 1980–2024 (percentage‑point change).
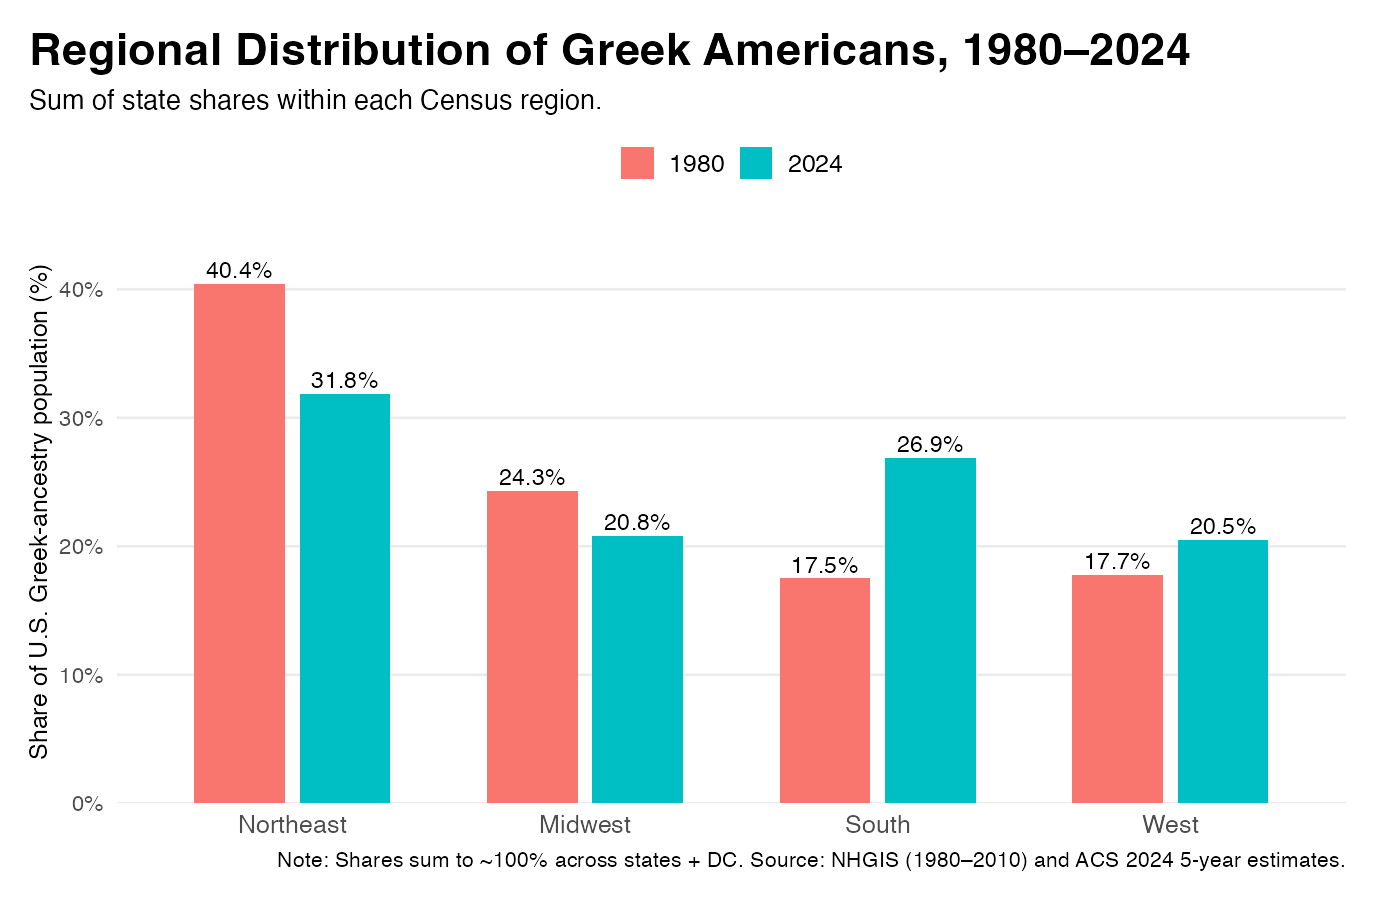
Figure 5. Regional shares of the U.S. Greek‑ancestry population, 1980 vs 2024 (sum of state shares by Census region).
Conclusion
From 1980 to 2010, the Greek-ancestry population grew; since 2010, it has declined.
Geographically, Greek Americans remain concentrated in a few large states, but state shares have gradually shifted toward the South and West.
Together, these patterns point to a community that remains concentrated in long-established gateways while also becoming more evenly spread across the country over time.
Source note
NHGIS: 1980–2010 decennial census ancestry tabulations.
ACS: 2024 5‑year estimates, ancestry.
All shares are calculated as each state’s count divided by the U.S. total (sum across states and DC).