Where Do Greek Americans Live? Population Shifts Since 1980
Using U.S. Census data (1980, 1990, 2000) and the 2010 and 2024 American Community Survey (ACS) 5-year estimates, this analysis examines how the geographic distribution of Greek Americans has evolved over four decades.
The overall pattern is clear: Greek Americans are more geographically dispersed today than they were in 1980.
A Long-Term Decline in Geographic Concentration
Figure 1 shows the normalized Herfindahl index, a measure of geographic concentration across all 50 states plus Washington, D.C.
In 1980, the index stood at approximately 0.053.
By 2024, it had declined to about 0.033.
Lower values indicate greater dispersion.
This steady decline means the Greek-American population is now more evenly distributed across states than it was 40 years ago. The change has been gradual and continuous, not sudden.
Traditional population centers did not disappear. Instead, their share of the national total declined as growth occurred elsewhere in the U.S.
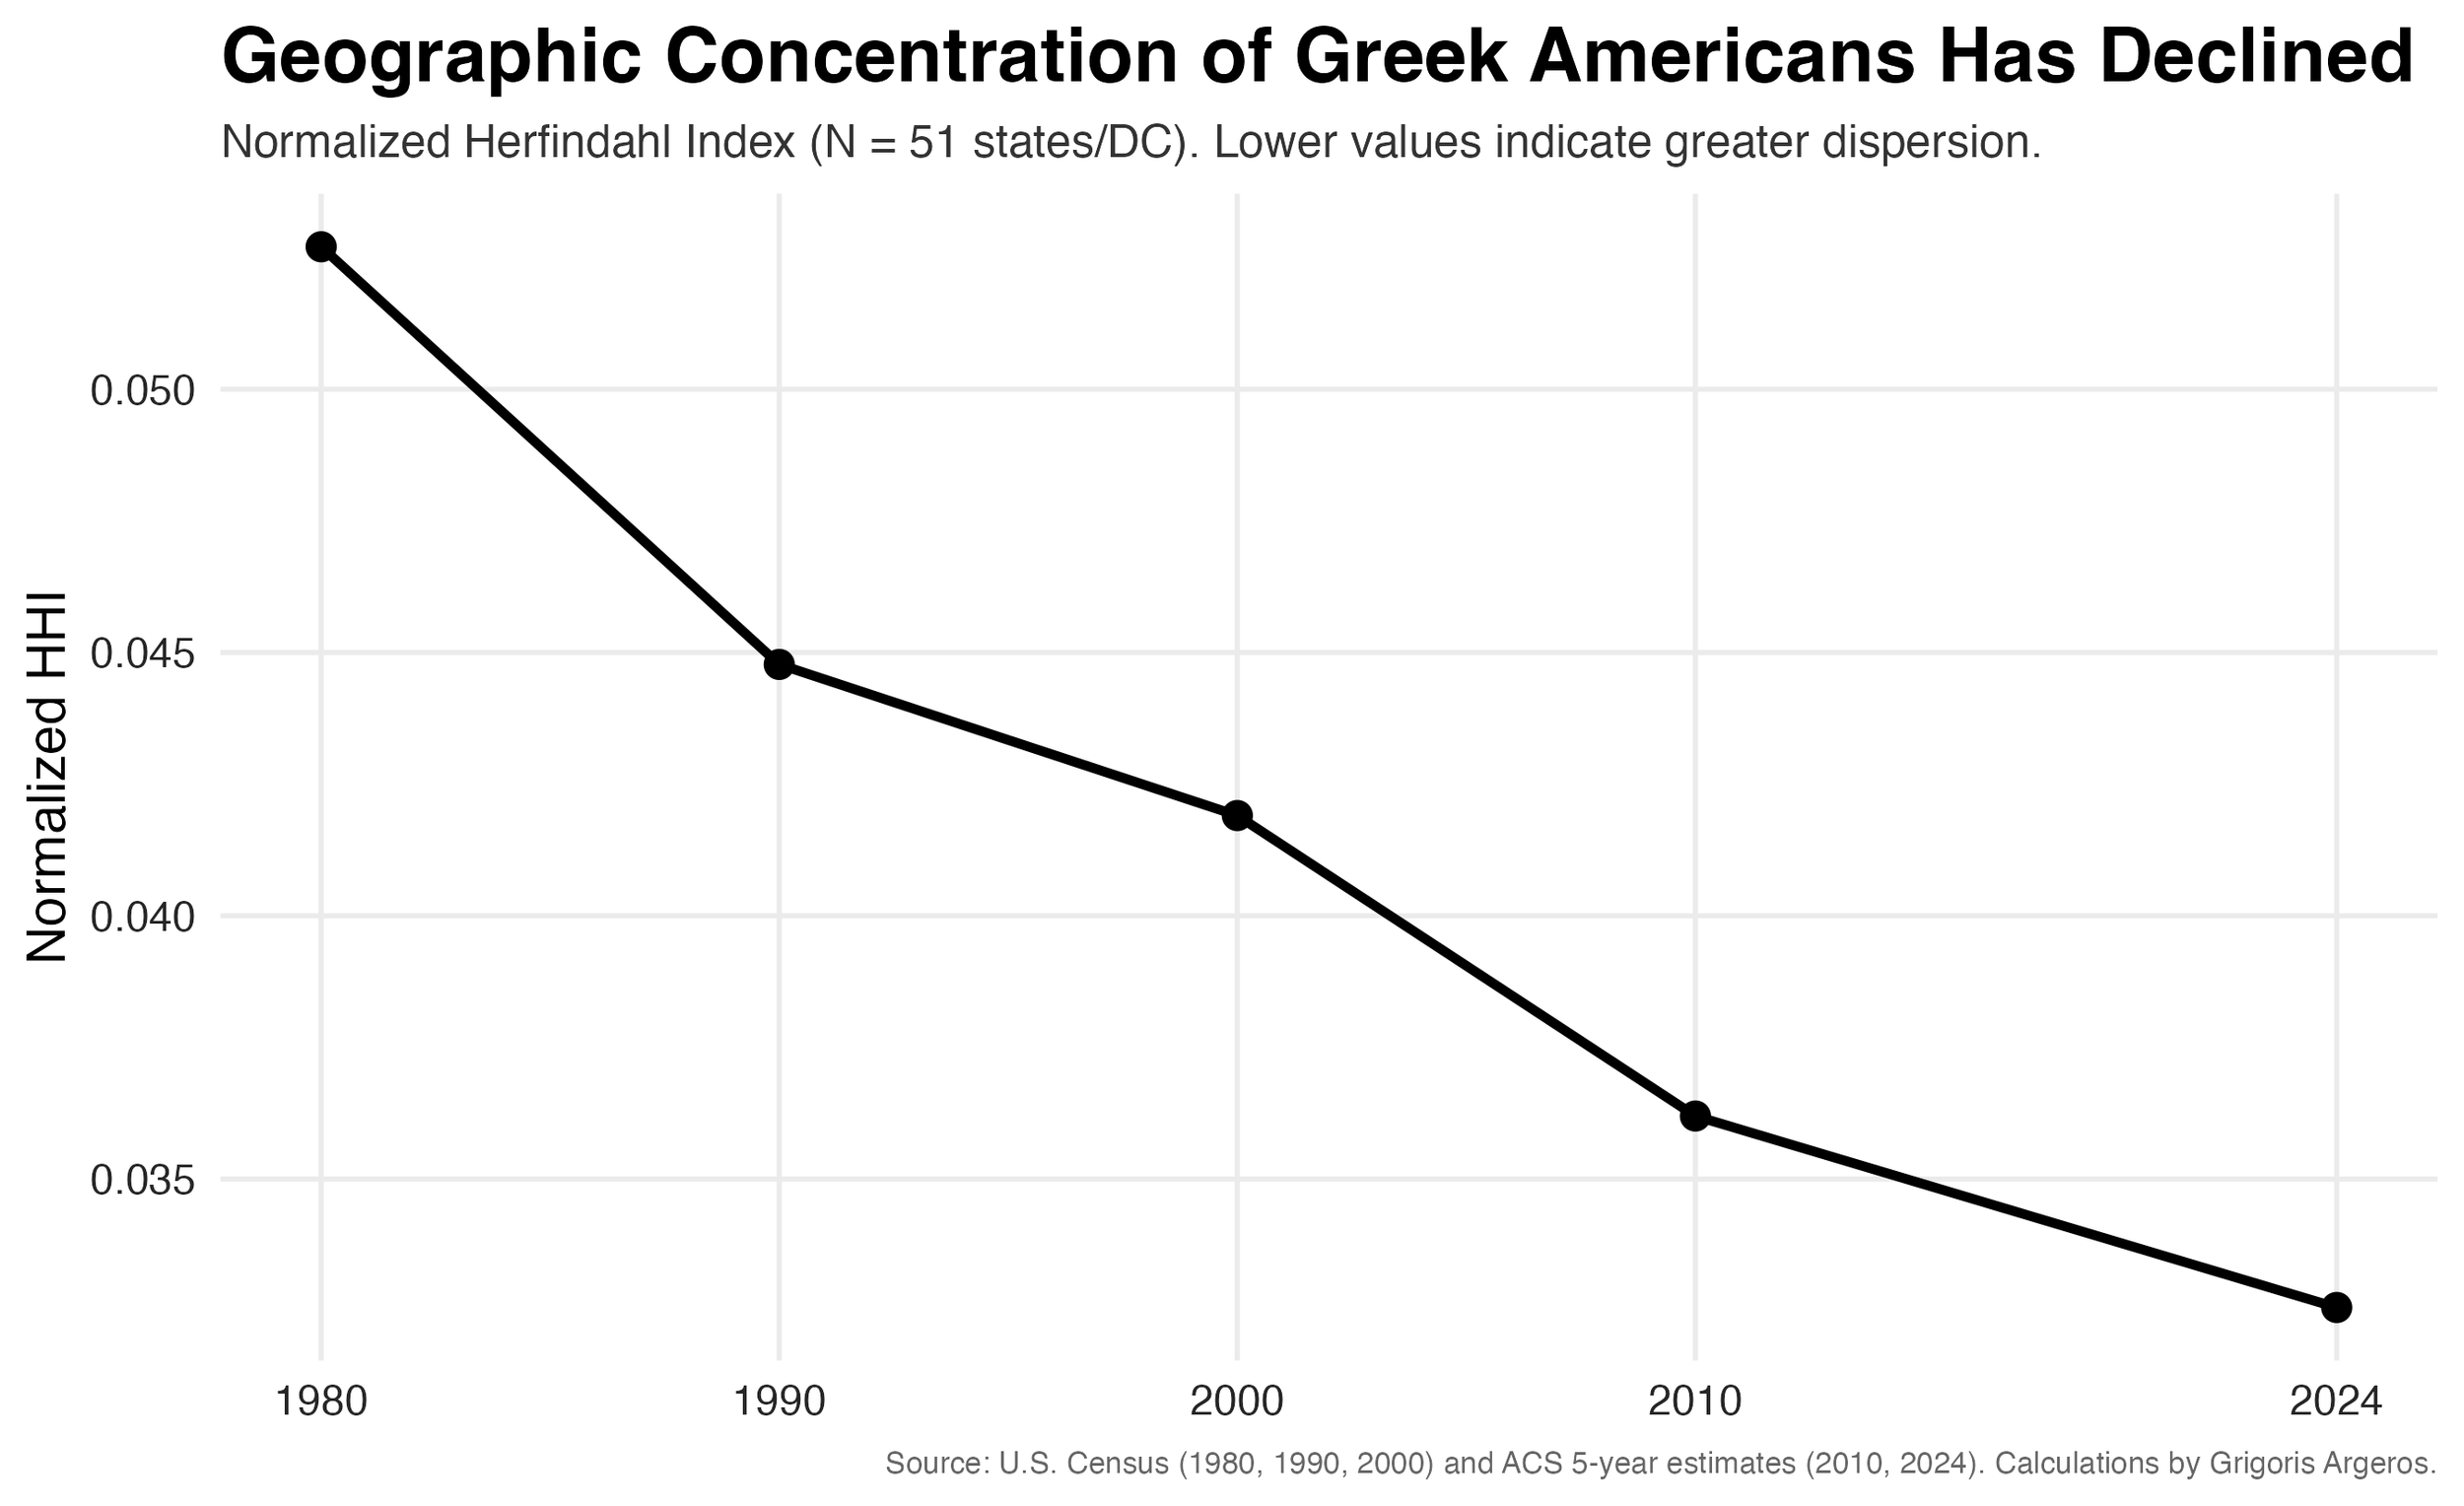
Figure 1. Geographic Concentration of Greek Americans, 1980–2024.
The normalized Herfindahl index declined from approximately 0.053 in 1980 to 0.033 in 2024, indicating greater geographic dispersion over time.
Table 1 reports the Greek-ancestry population by state in 2024, along with each state’s share of the total U.S. Greek population (approximately 1.2 million).
The largest state populations remain concentrated in:
New York
California
Illinois
Massachusetts
Florida
Together, these five states account for nearly half of all Greek Americans.
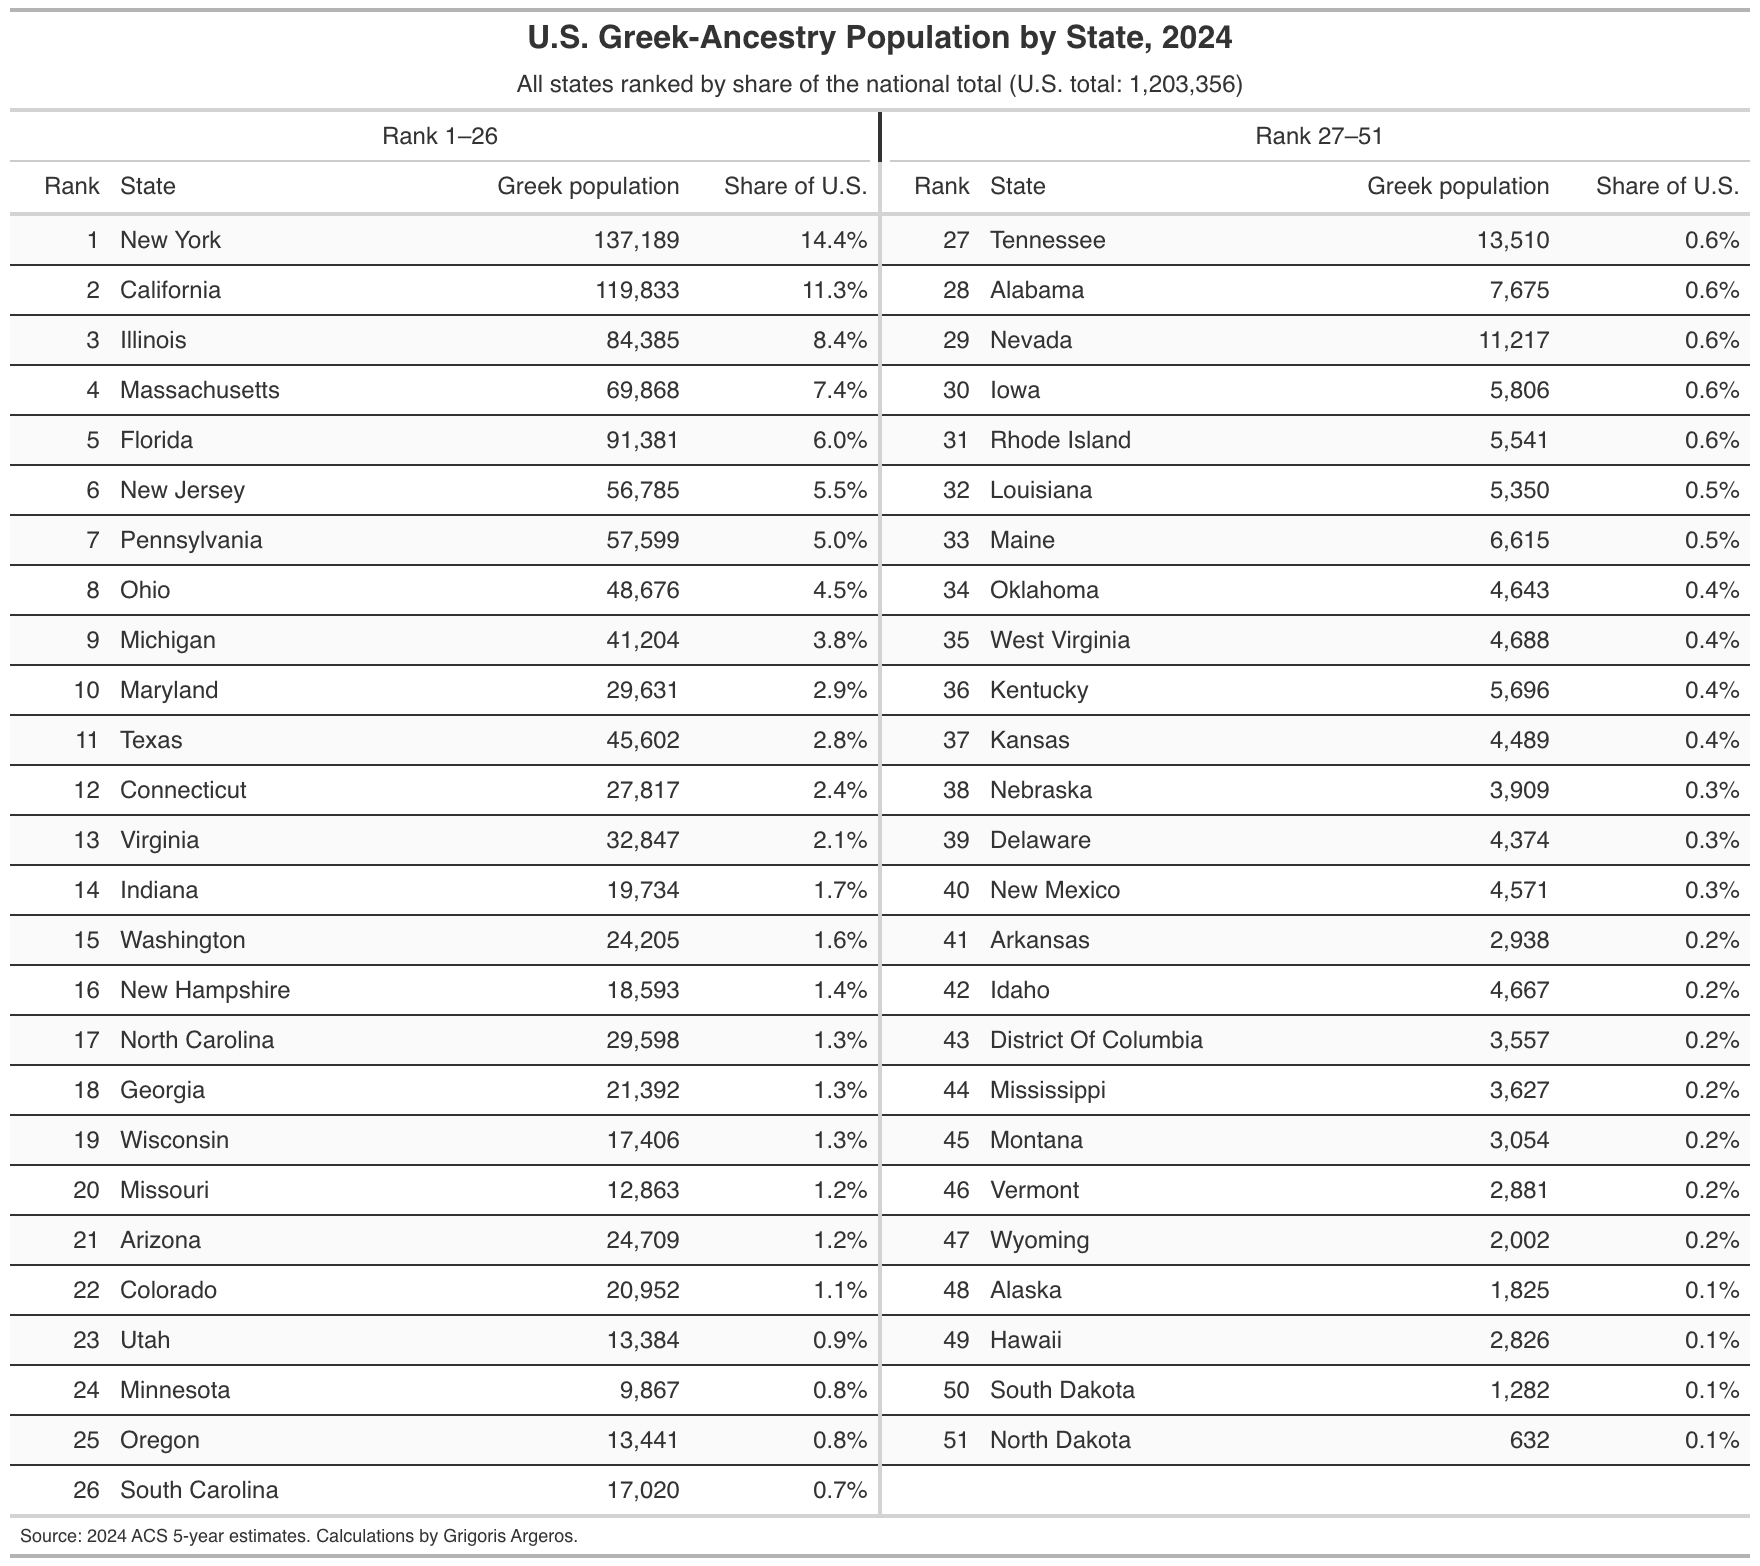
Table 1. U.S. Greek-Ancestry Population by State, 2024.
New York, California, Illinois, Massachusetts, and Florida account for nearly half of the national total.
State-Level Changes Since 1980
Figure 2 maps the percentage-point change in each state’s share of the national Greek-ancestry population between 1980 and 2024.
The map shows a slow but steady shift.
Gains are concentrated in parts of the South and selected Sun Belt states.
Several Northeast and Midwest states show relative declines.
Most states changed only modestly, often by less than one percentage point.
These figures reflect changes in the relative share of the national total, not necessarily declines in absolute population.
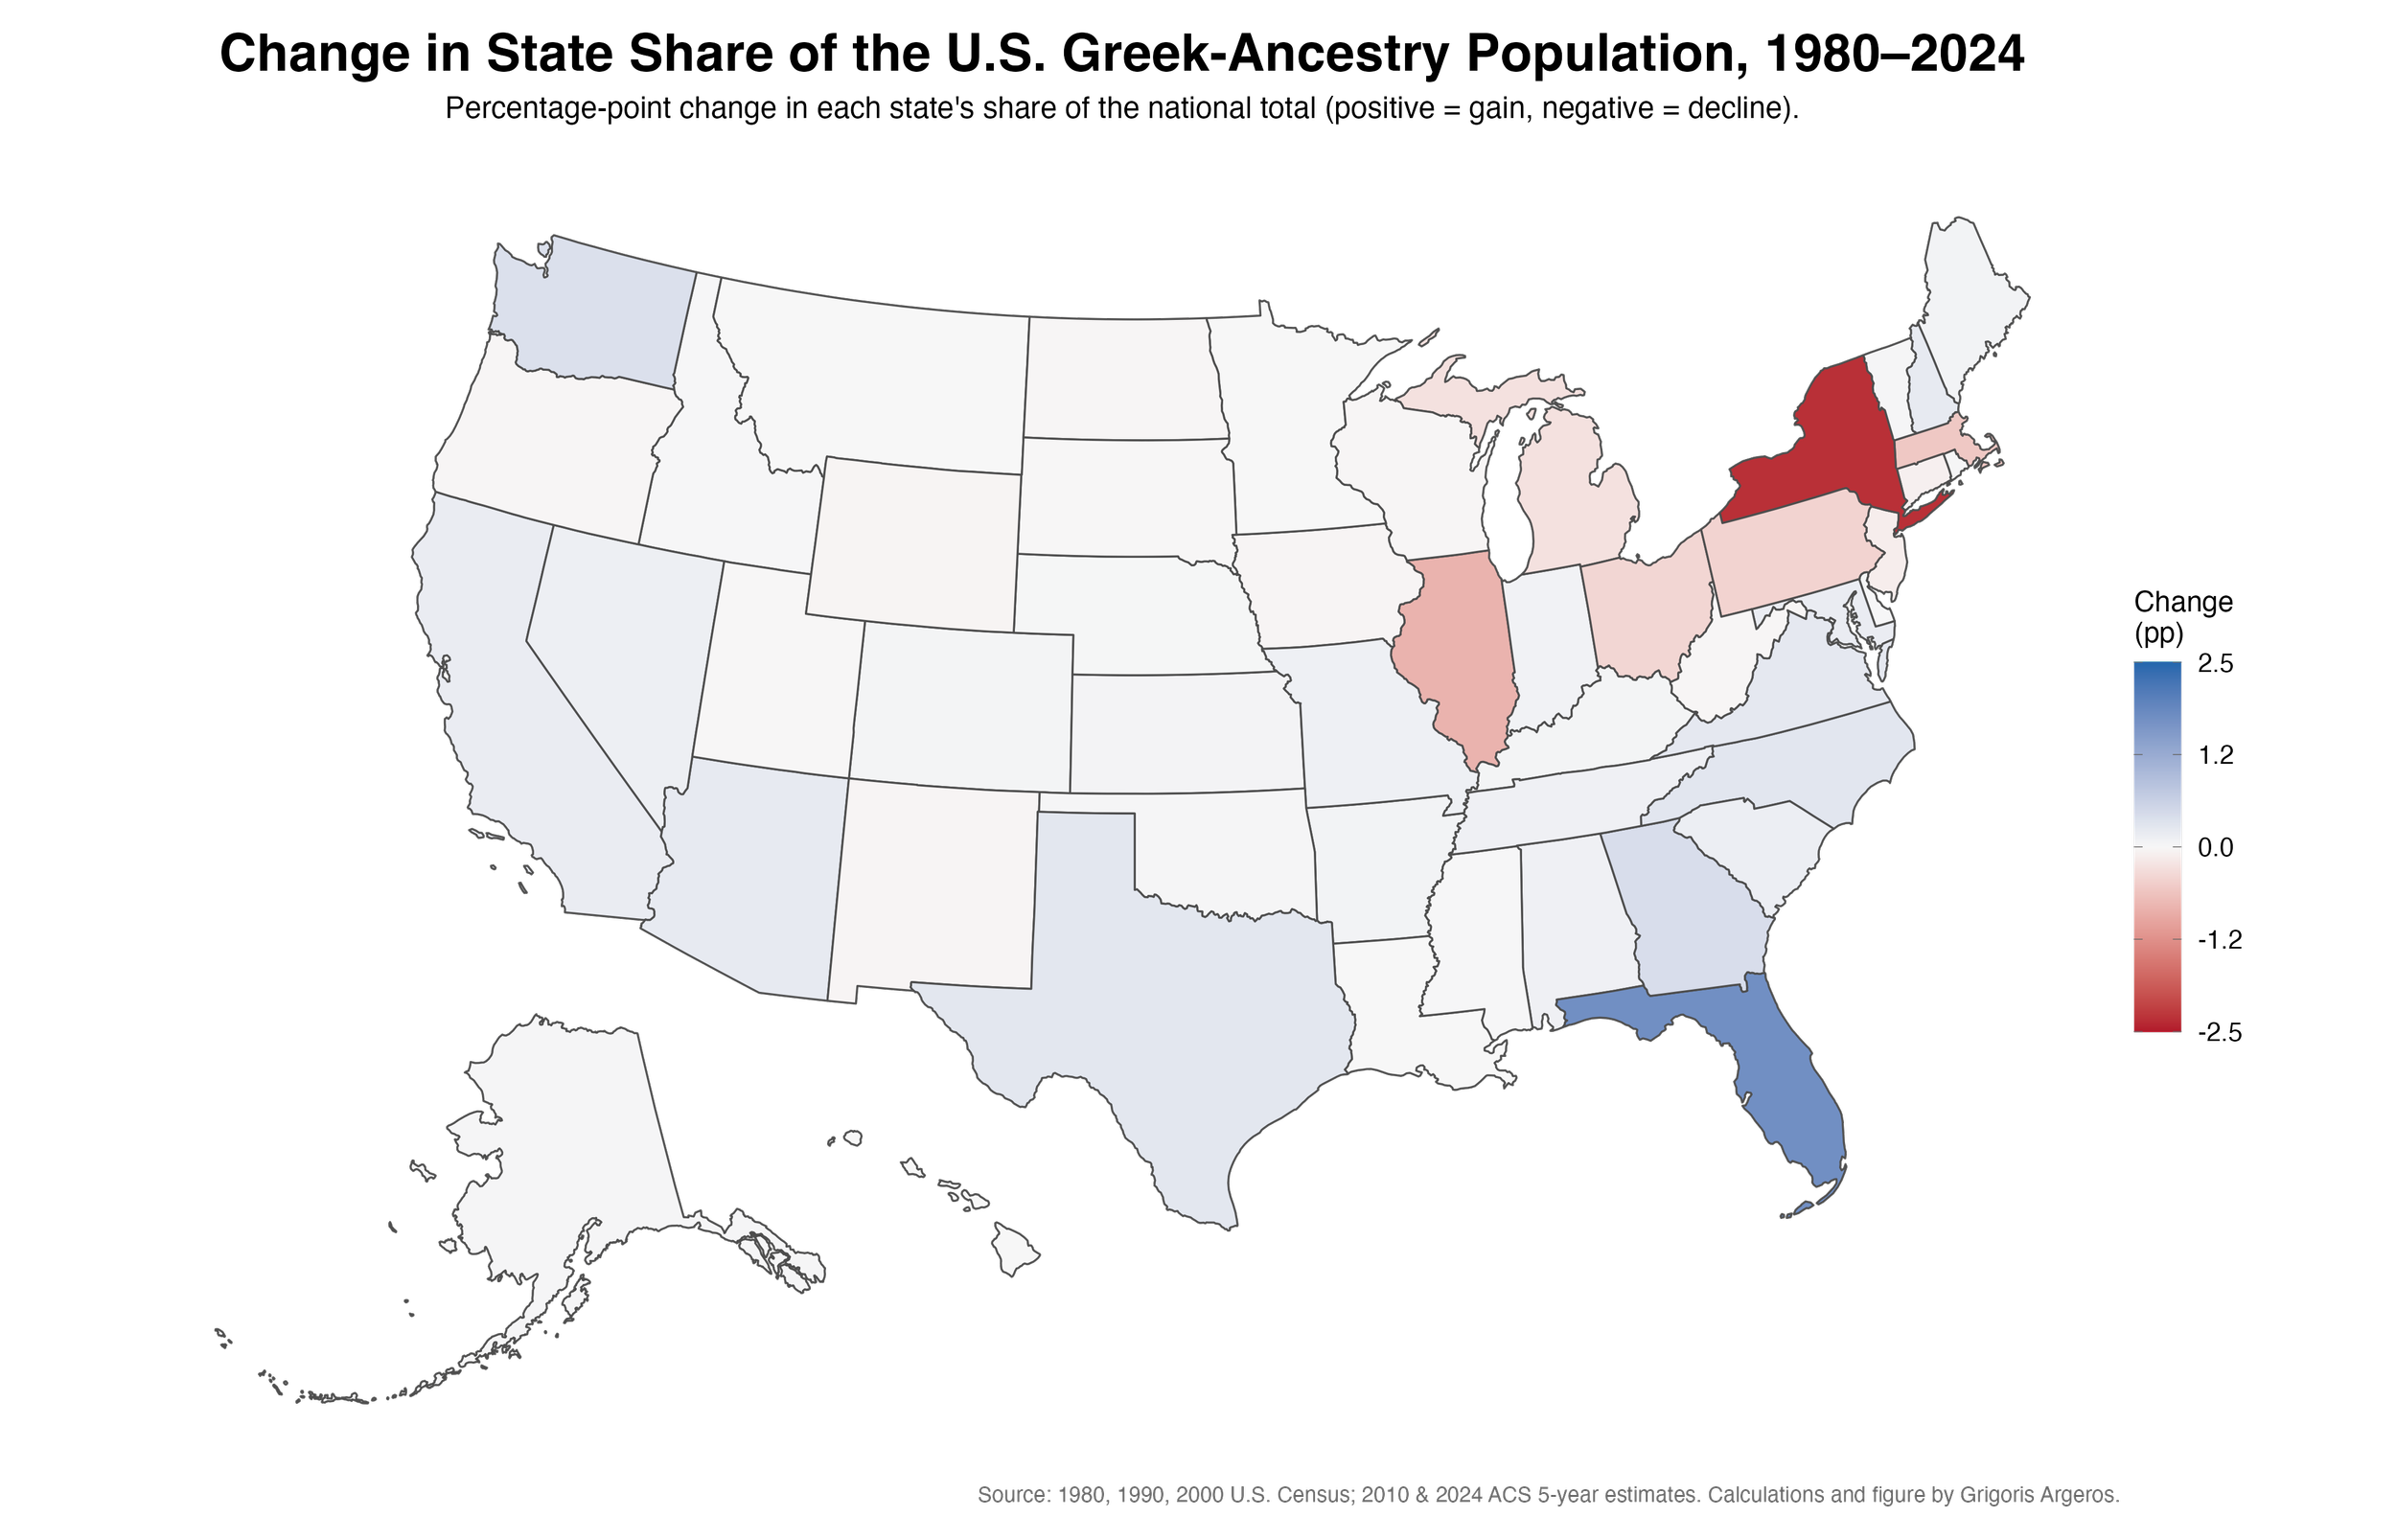
Figure 2. Percentage-point change in each state's share of the national Greek-ancestry population.
Florida shows the largest gain, while New York shows the largest decline in relative share.
Changes Among the Largest States
To better understand shifts in traditional population centers, Figure 3 focuses on the states that ranked among the top 15 in 1980. In that year, those states accounted for 82% of the U.S. Greek-ancestry population.
Florida shows the largest increase in share.
North Carolina, Texas, Arizona, and Virginia also show gains.
New York, Illinois, and Massachusetts show the largest declines in relative share.
Importantly, these changes took place slowly over many years.
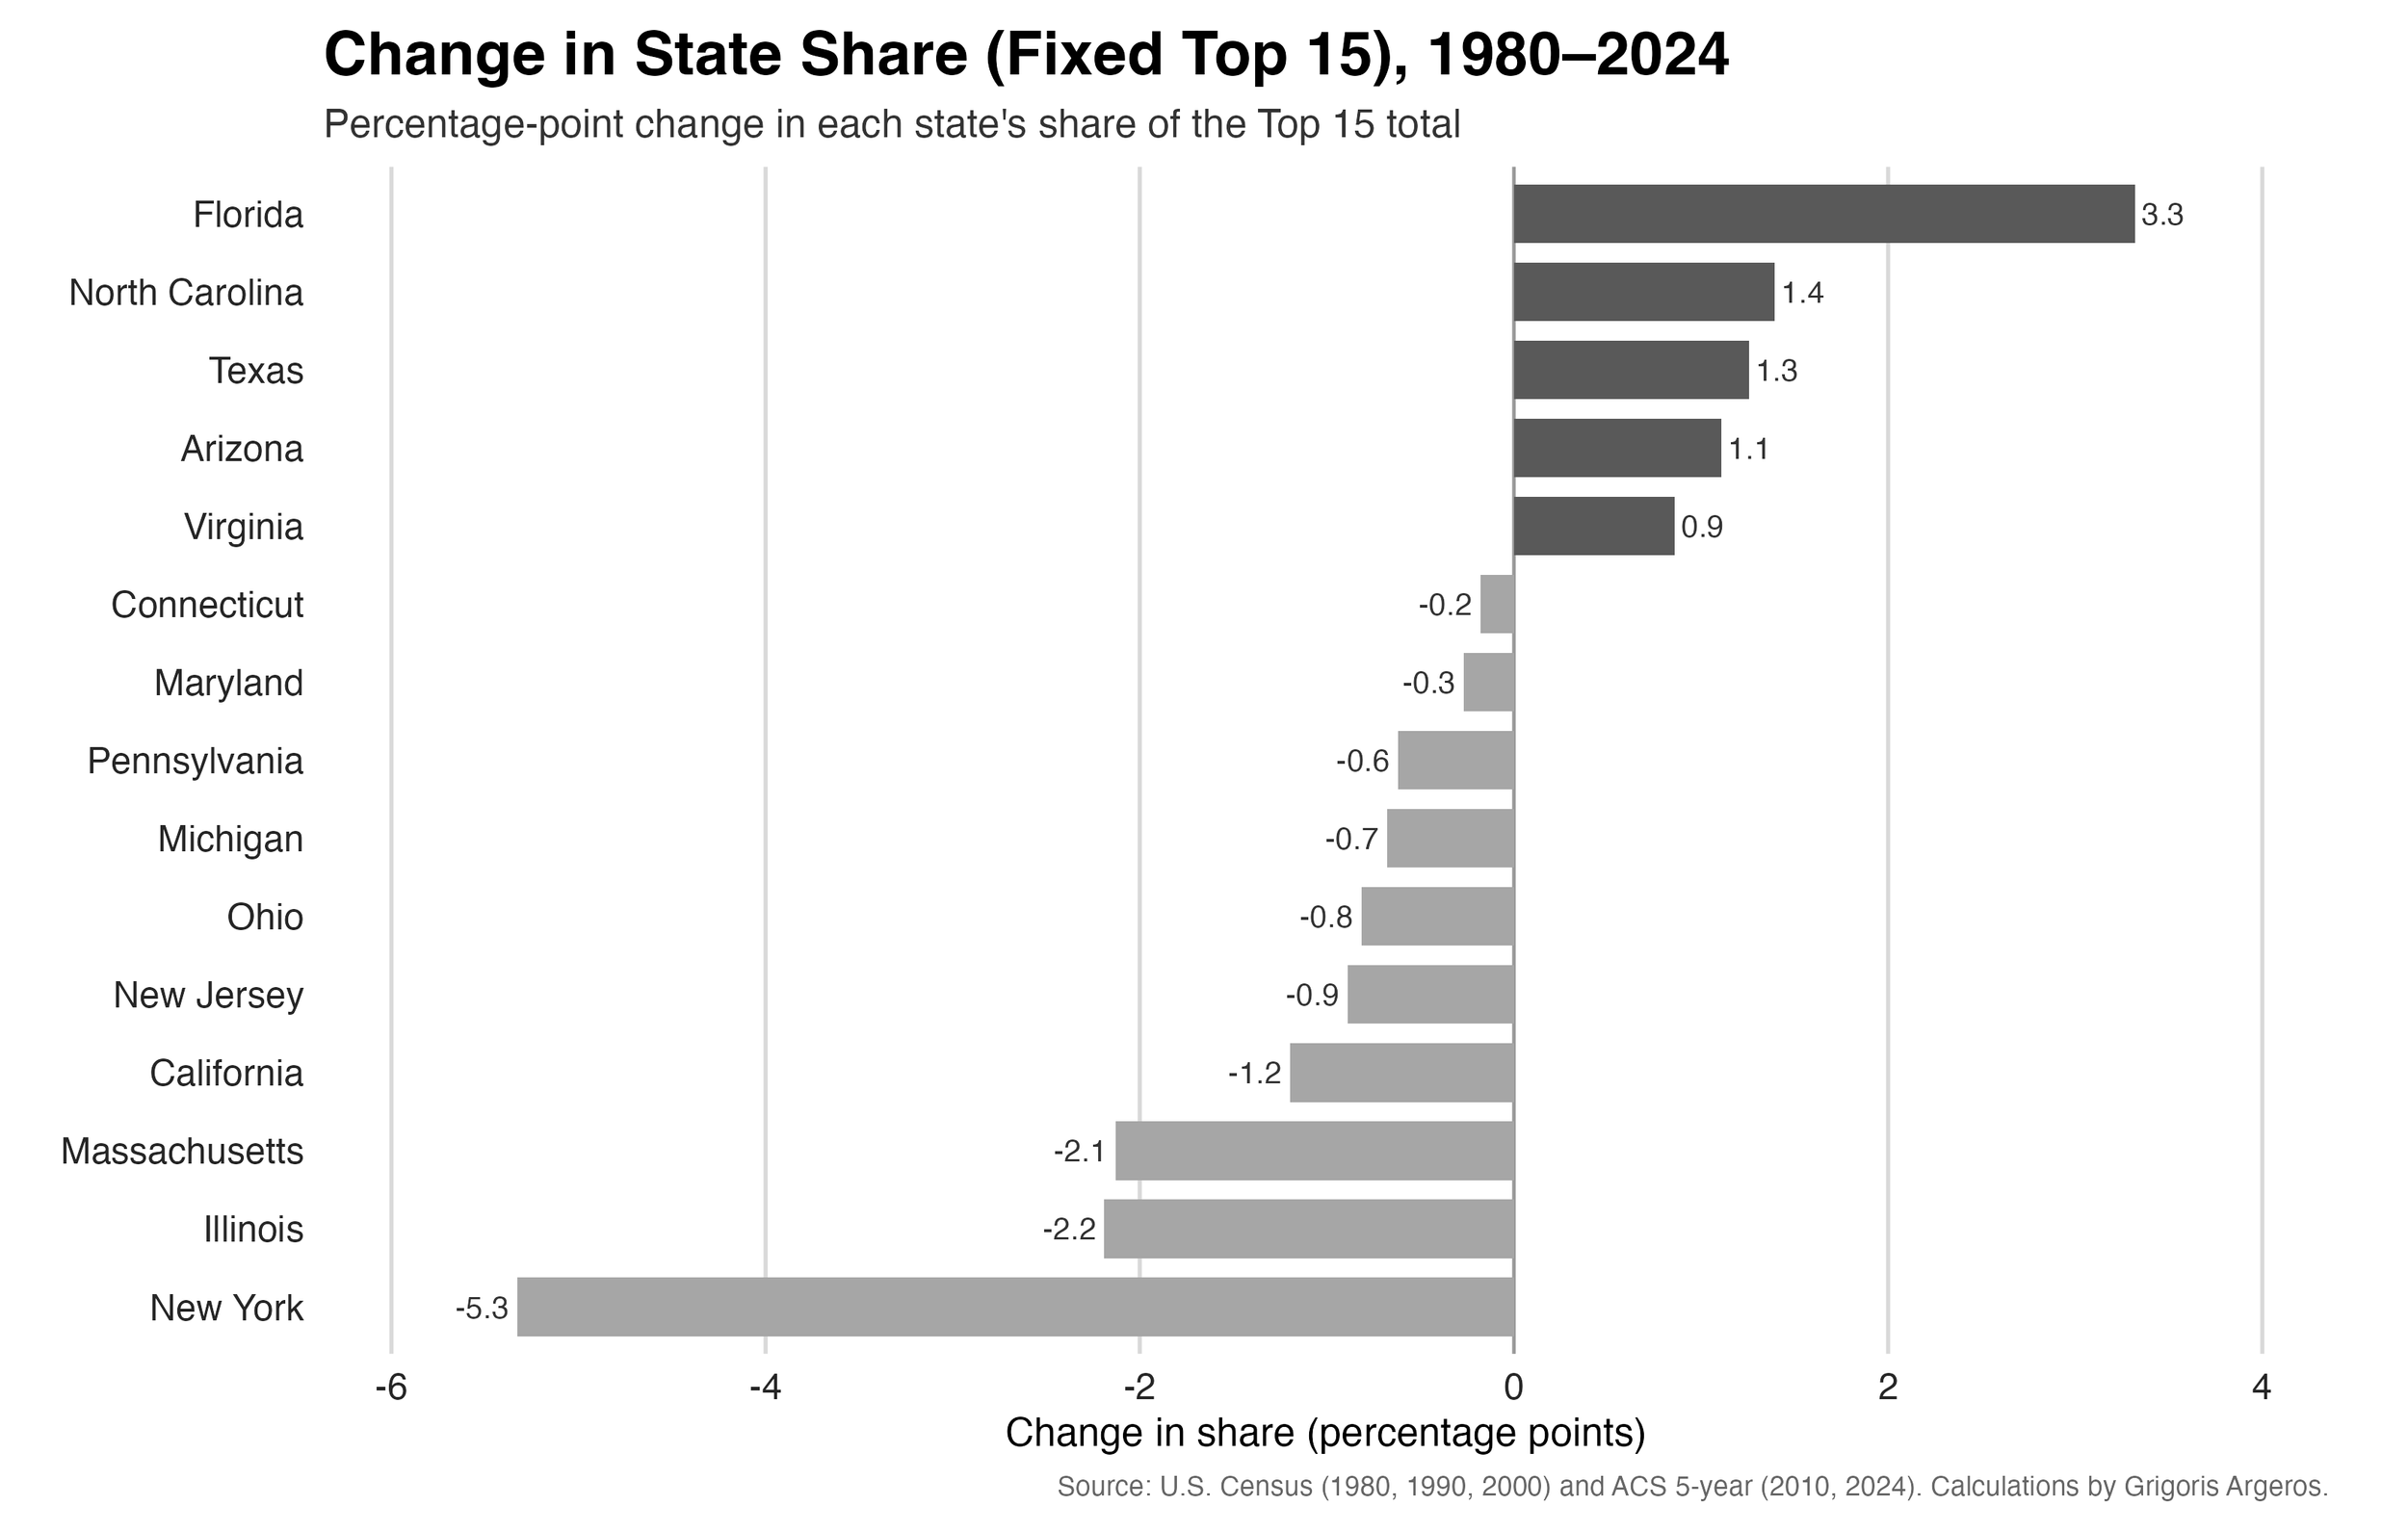
Figure 3. Change in share among the top 15 states in 1980.
Florida, North Carolina, and Texas show notable gains, while New York and Illinois show the largest declines.
A Regional Shift Toward the South
The regional picture reinforces this slow redistribution. See Figure 4.
Since 1980:
The Northeast’s share has steadily declined.
The South’s share has increased substantially.
The Midwest has declined modestly.
The West has risen slightly.
In 1980, the Northeast accounted for roughly 40% of the national Greek-ancestry population. By 2024, that share had fallen to about 32%.
Over the same period, the South’s share rose from roughly 18% to nearly 27%.
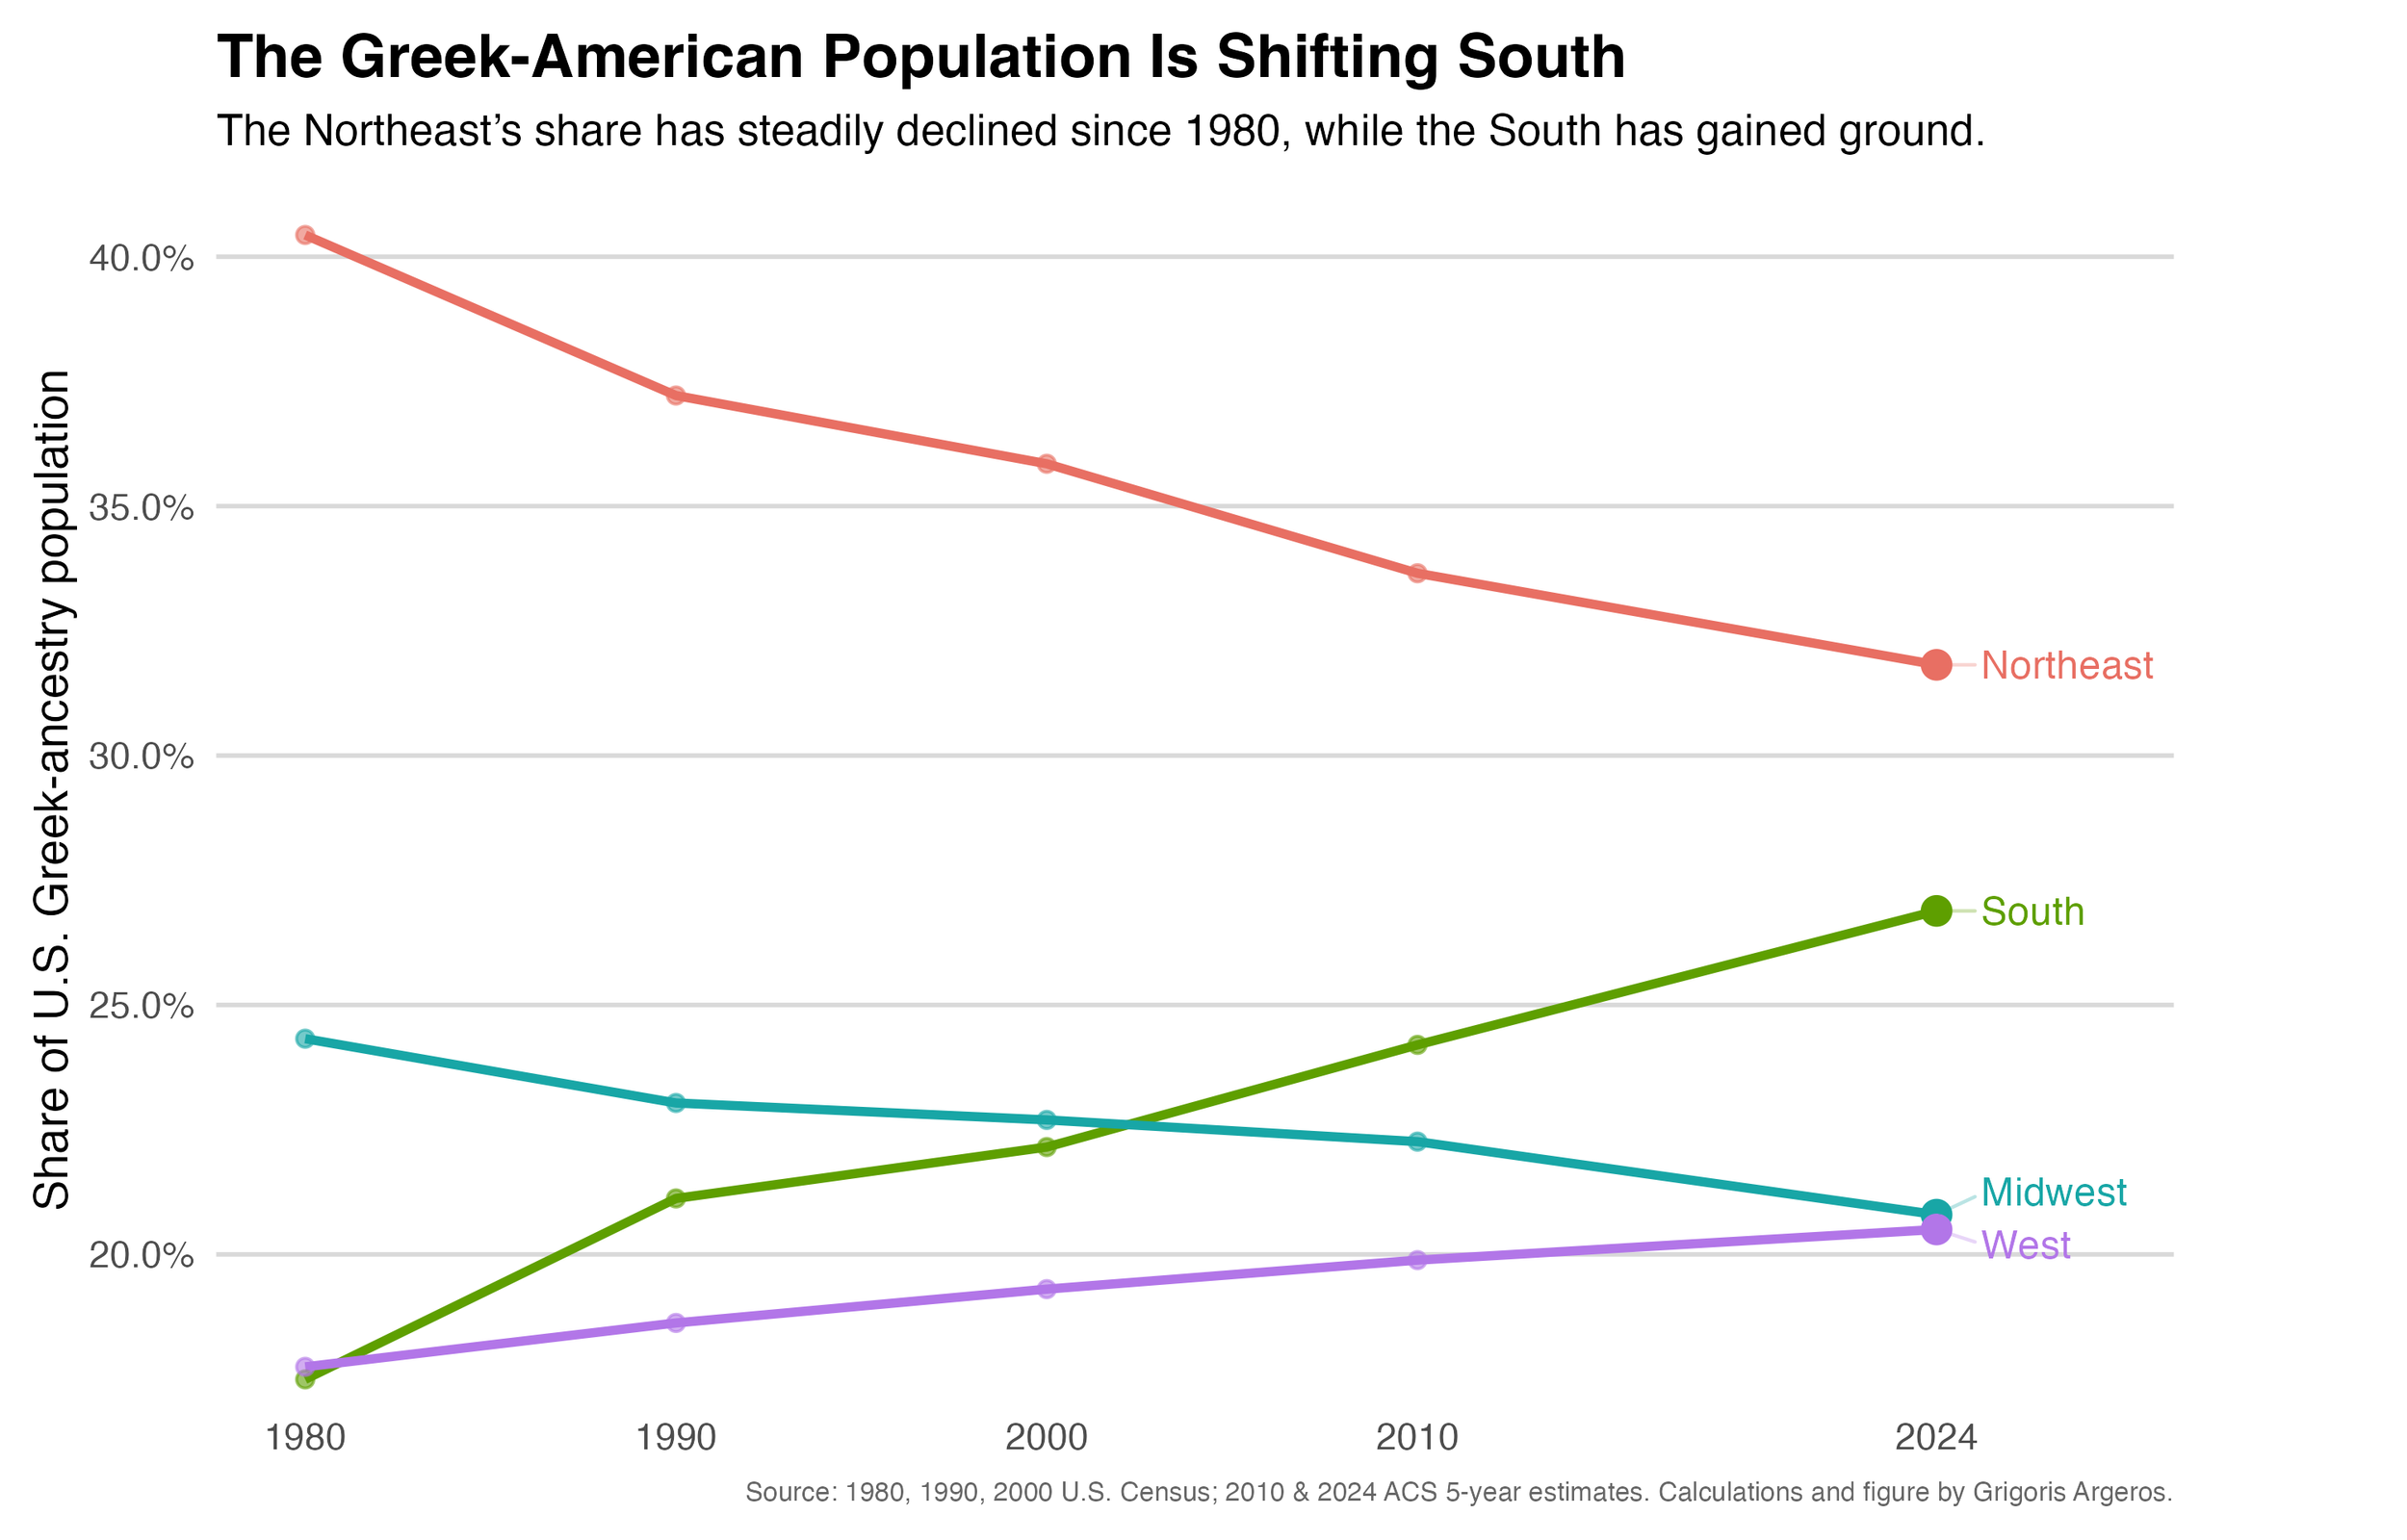
Figure 4. Regional distribution of the U.S. Greek-ancestry population, 1980–2024.
The Northeast’s share has declined steadily, while the South’s share has increased.