Greek Immigrants in the United States, 2024: Population, Demographic, and Socioeconomic Characteristics
This brief examines individuals born in Greece living in the United States using recent Census data from the American Community Survey (ACS). It focuses on population size, geographic distribution, demographic, and socioeconomic characteristics. The brief also includes sections on global destinations of Greek emigrants and remittances to Greece.
Differences reported in this brief were tested for statistical significance. Unless otherwise noted, all differences discussed are statistically significant.
1. Population Size and Growth
The number of individuals born in Greece living in the U.S. has changed over time. Overall, the long-term pattern shows growth through 1980, followed by a gradual decline and a modest rebound in recent years.
In 1960, approximately 159,000 Greece-born individuals lived in the United States. This number increased to about 177,000 in 1970 and peaked at roughly 211,000 in 1980.
The growth in Greek immigration after 1960 is largely due to changes in immigration laws, particularly the 1965 Hart-Celler Act. Between 1960 and 1980, the Greek immigrant population increased by approximately 33%, reaching about 211,000. Since 1980, however, the Greece-born population has generally declined. The number fell to about 177,000 in 1990, 166,000 in 2000, and 143,000 in 2010.
Overall, the Greece-born population declined by about 24% between 1980 and 2024. At the same time, the Greek-born population increased slightly between 2010 and 2024, reaching approximately 161,000. This increase may reflect increased immigration from Greece following the economic crisis of the early 2010s.
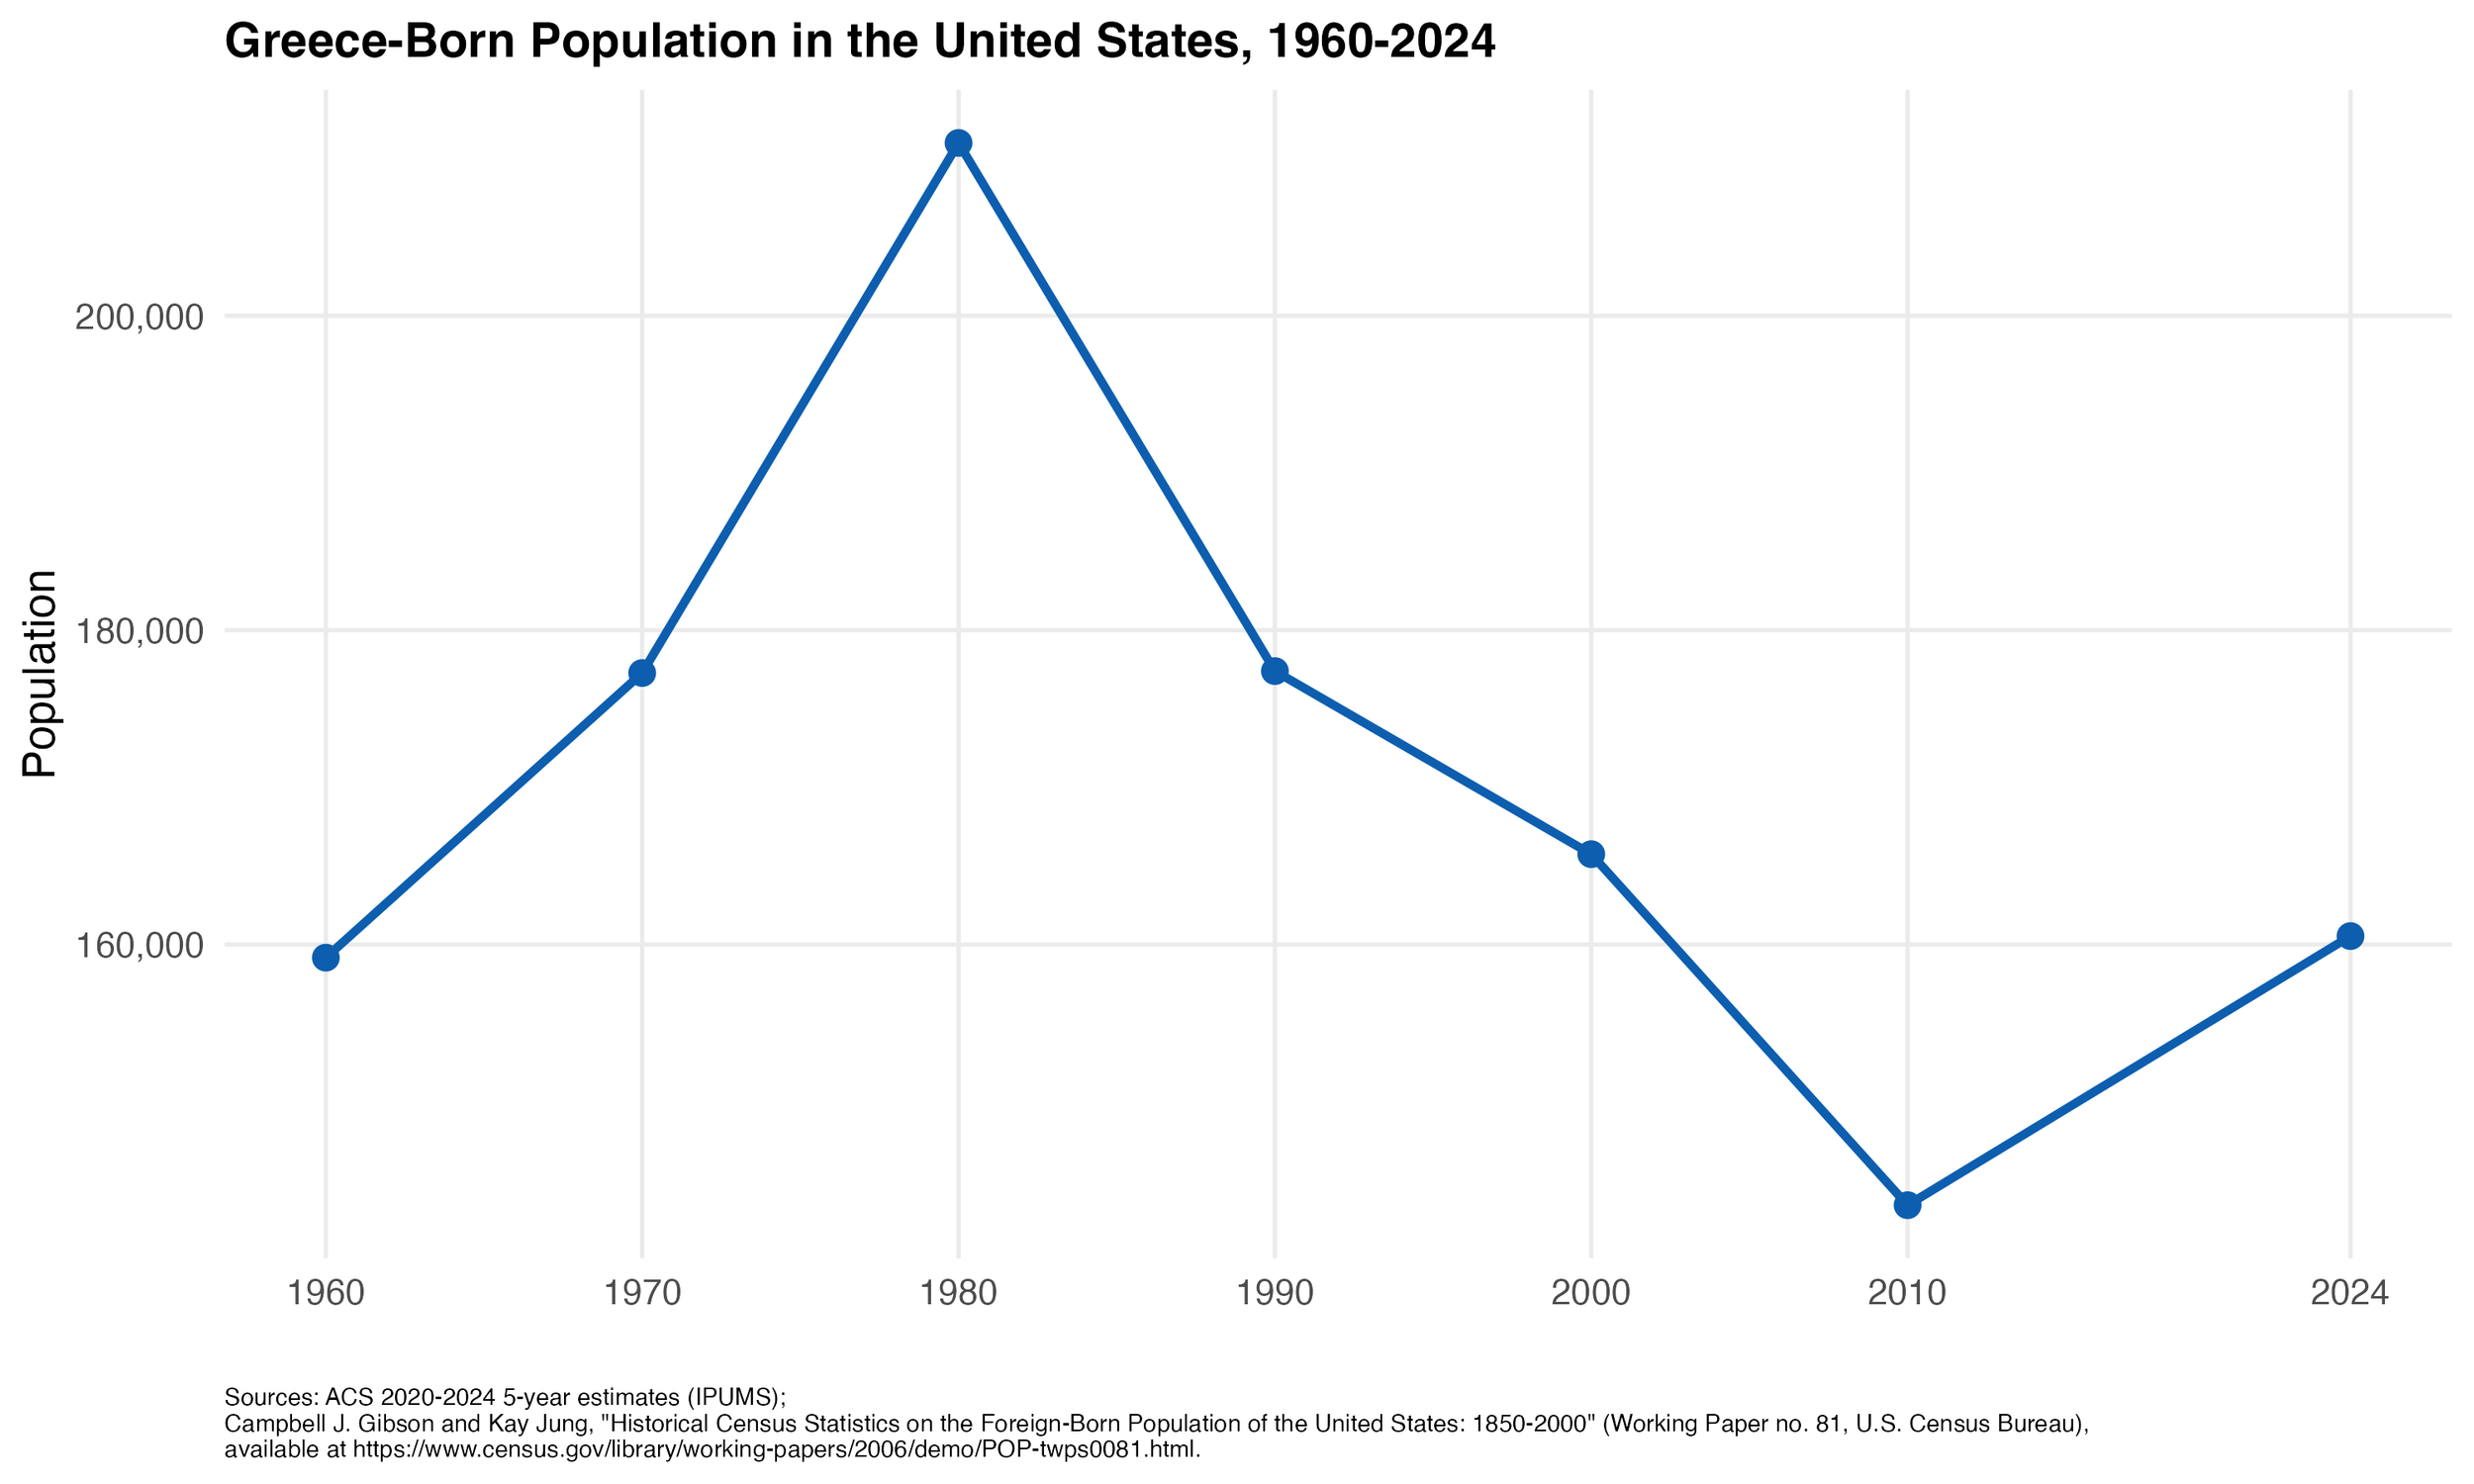
Figure 1: Greece-Born Population in the United States, 1960-2024
2. Geographic Distribution
State distribution
The Greece-born population is concentrated in a relatively small number of states, particularly in the Northeast and Midwest. Together, these two regions account for just under two-thirds of all Greece-born individuals in the United States. Collectively, the top 15 states account for approximately 86% of all Greece-born individuals in the U.S.
New York has the largest Greece-born population, accounting for approximately 22% of all Greece-born residents in the U.S. Illinois ranks second with about 10%, followed by New Jersey (8%), California (8%), and Florida (8%). Massachusetts also has a sizable Greece-born population, accounting for about 7%. Together, these six states account for roughly 62% of the Greece-born population in the United States.
A second group of states includes Michigan (4%), Pennsylvania (4%), Texas (3%), and Ohio (3%). These states have long-established Greek communities but smaller populations than the leading states. Additional states in the top 15 include Connecticut, Virginia, North Carolina, Maryland, and Indiana, each with smaller Greek-born populations.
Overall, Greece-born individuals are concentrated in states in the Northeast and Midwest, with smaller but notable shares in states such as Florida, Texas, North Carolina, and Virginia.
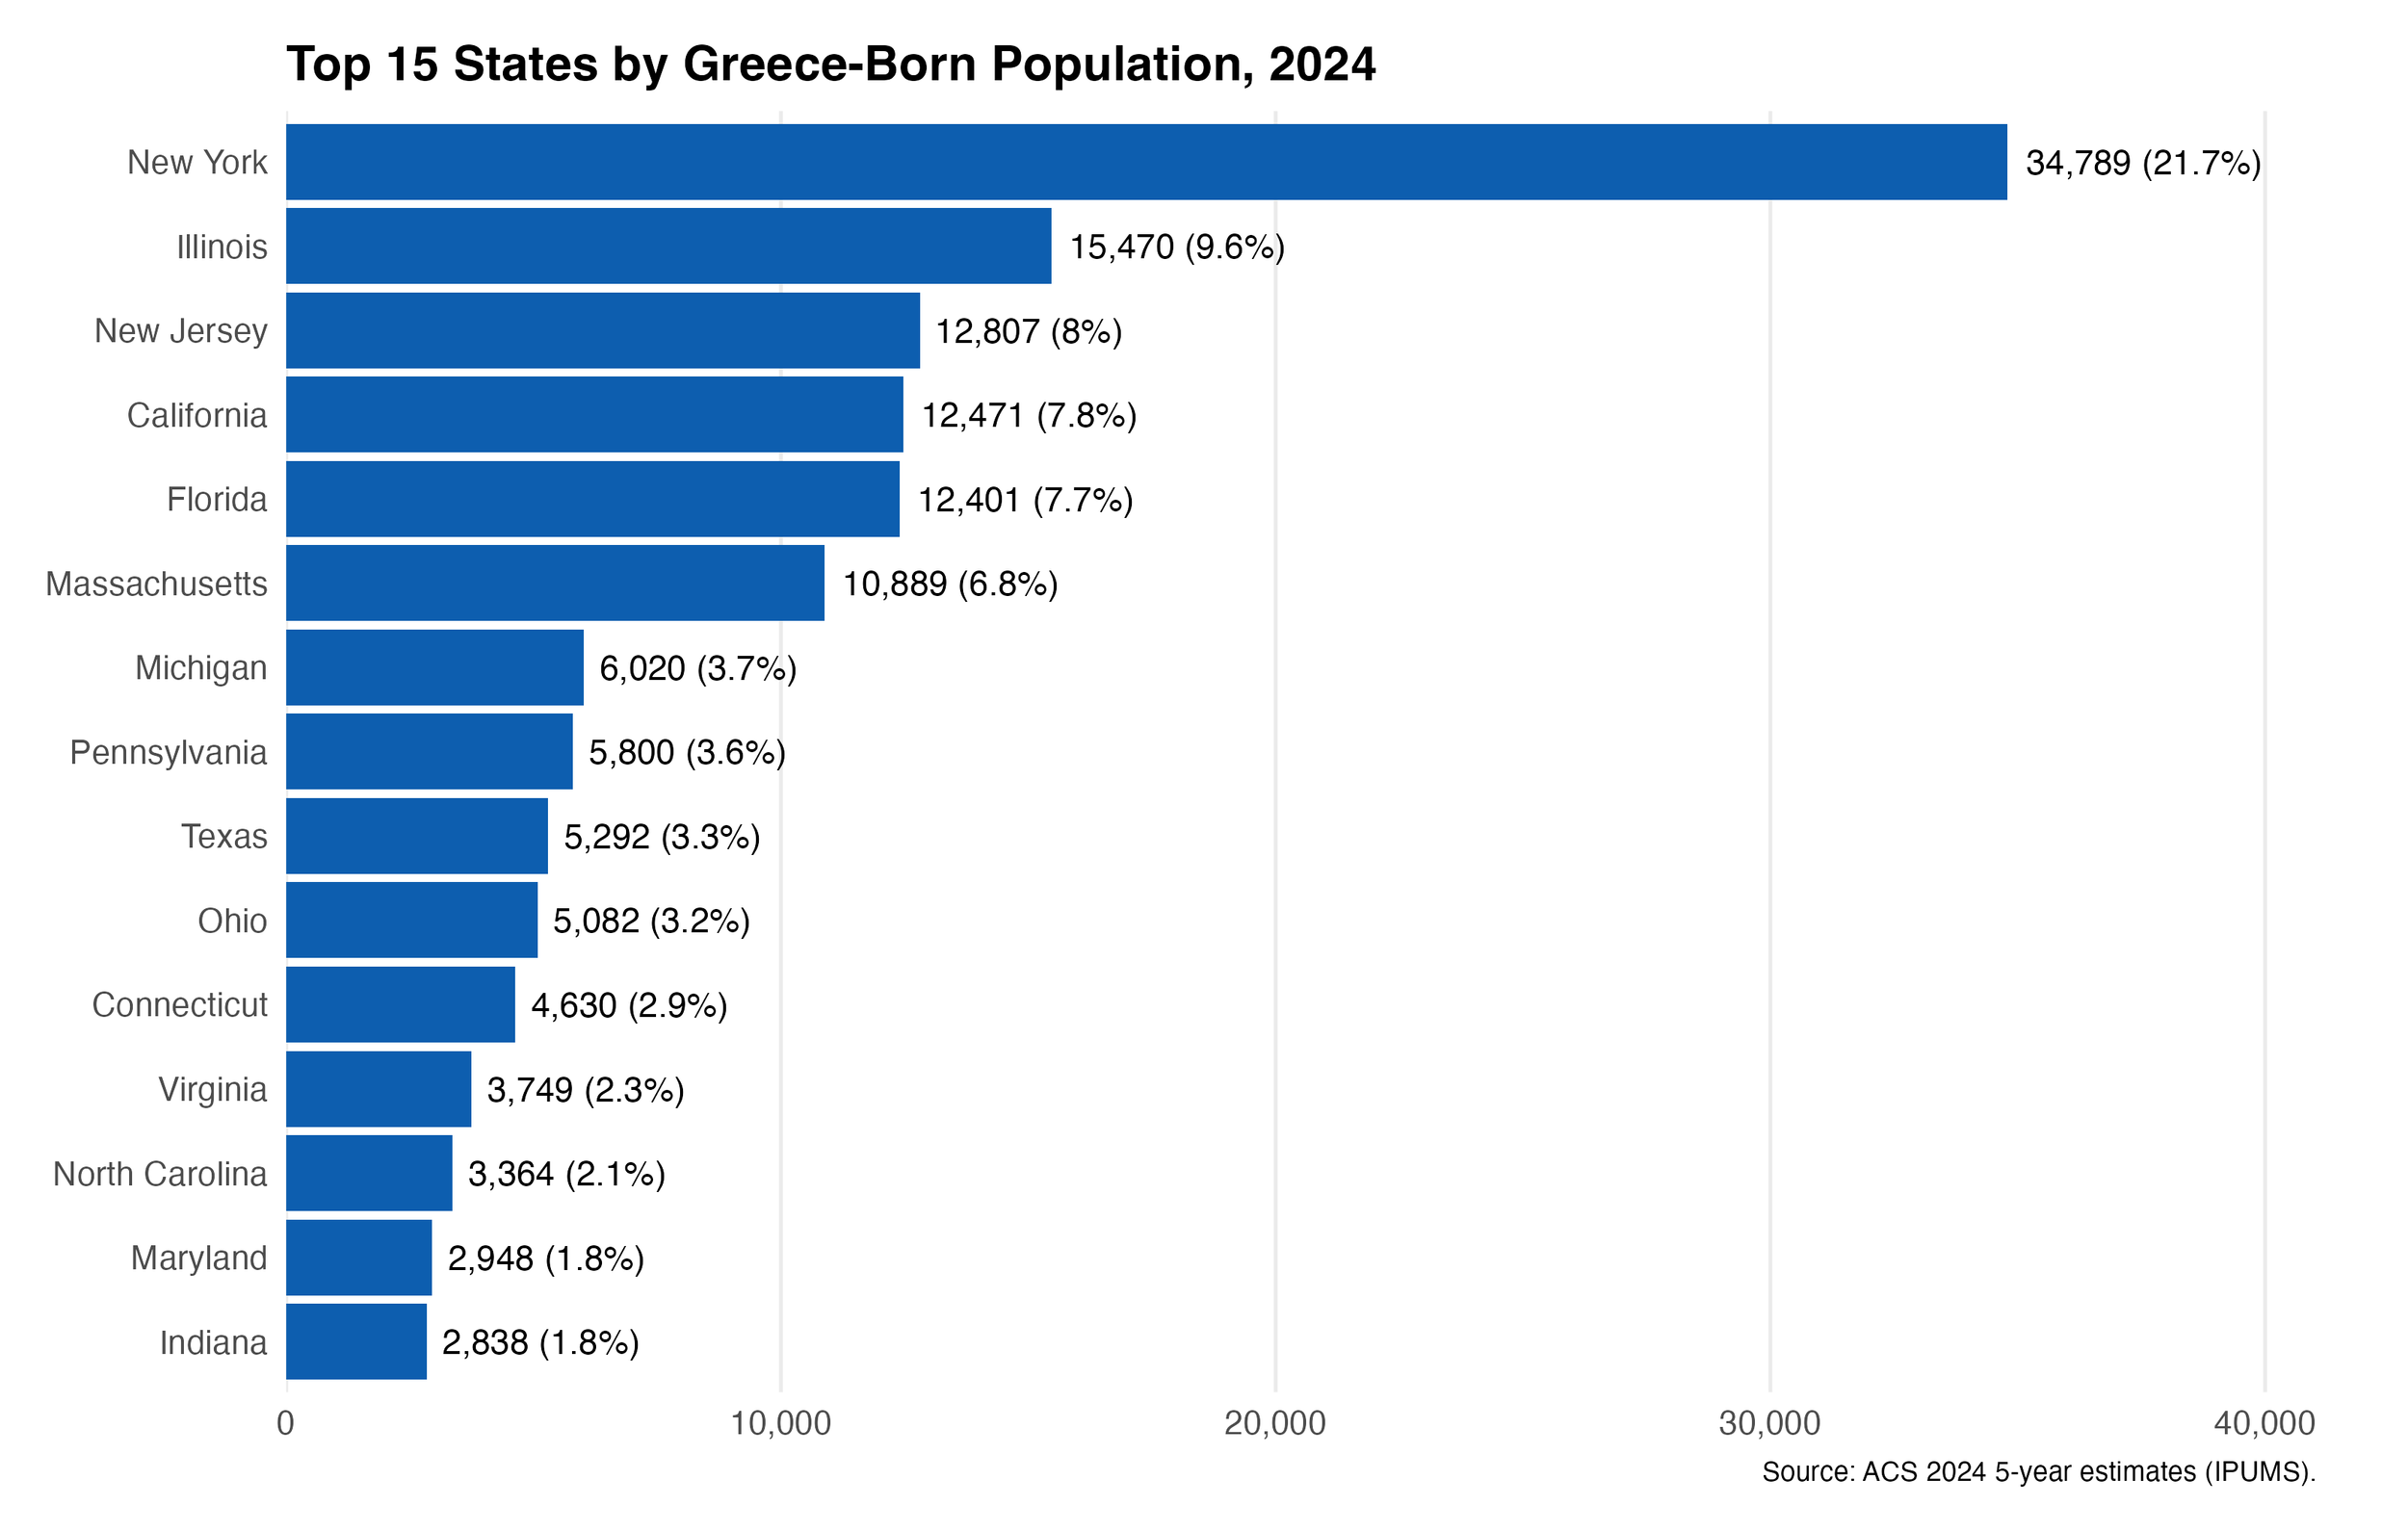
Figure 2: Top 15 States by Greece-Born Population, 2024
Metropolitan distribution
The Greece-born population in the United States is highly concentrated in a relatively small number of metropolitan areas. The top 15 metropolitan areas account for 70% of all Greece-born individuals, highlighting the strong clustering of Greek immigrants in major urban regions.
The New York-Newark-Jersey City metropolitan area has the largest Greece-born population, accounting for about 26% of all Greece-born residents in the United States. The Chicago-Naperville-Elgin metropolitan area ranks second with 10%, followed by Boston-Cambridge-Newton with 6%.
A second tier includes Detroit-Warren-Dearborn (3.1%), Tampa-St. Petersburg-Clearwater (2.9%), Los Angeles-Long Beach-Anaheim (2.9%), Philadelphia-Camden-Wilmington (2.7%), and Washington-Arlington-Alexandria (2.6%). Additional metropolitan areas in the top 15 include Miami, San Francisco, Houston, Bridgeport, Dallas-Fort Worth, Charlotte, and Atlanta, each with smaller but notable Greek-born populations.
Overall, the distribution reflects both long-standing Greek settlement in major Northeastern and Midwestern metropolitan areas and more recent dispersion to metropolitan areas in the South and West.
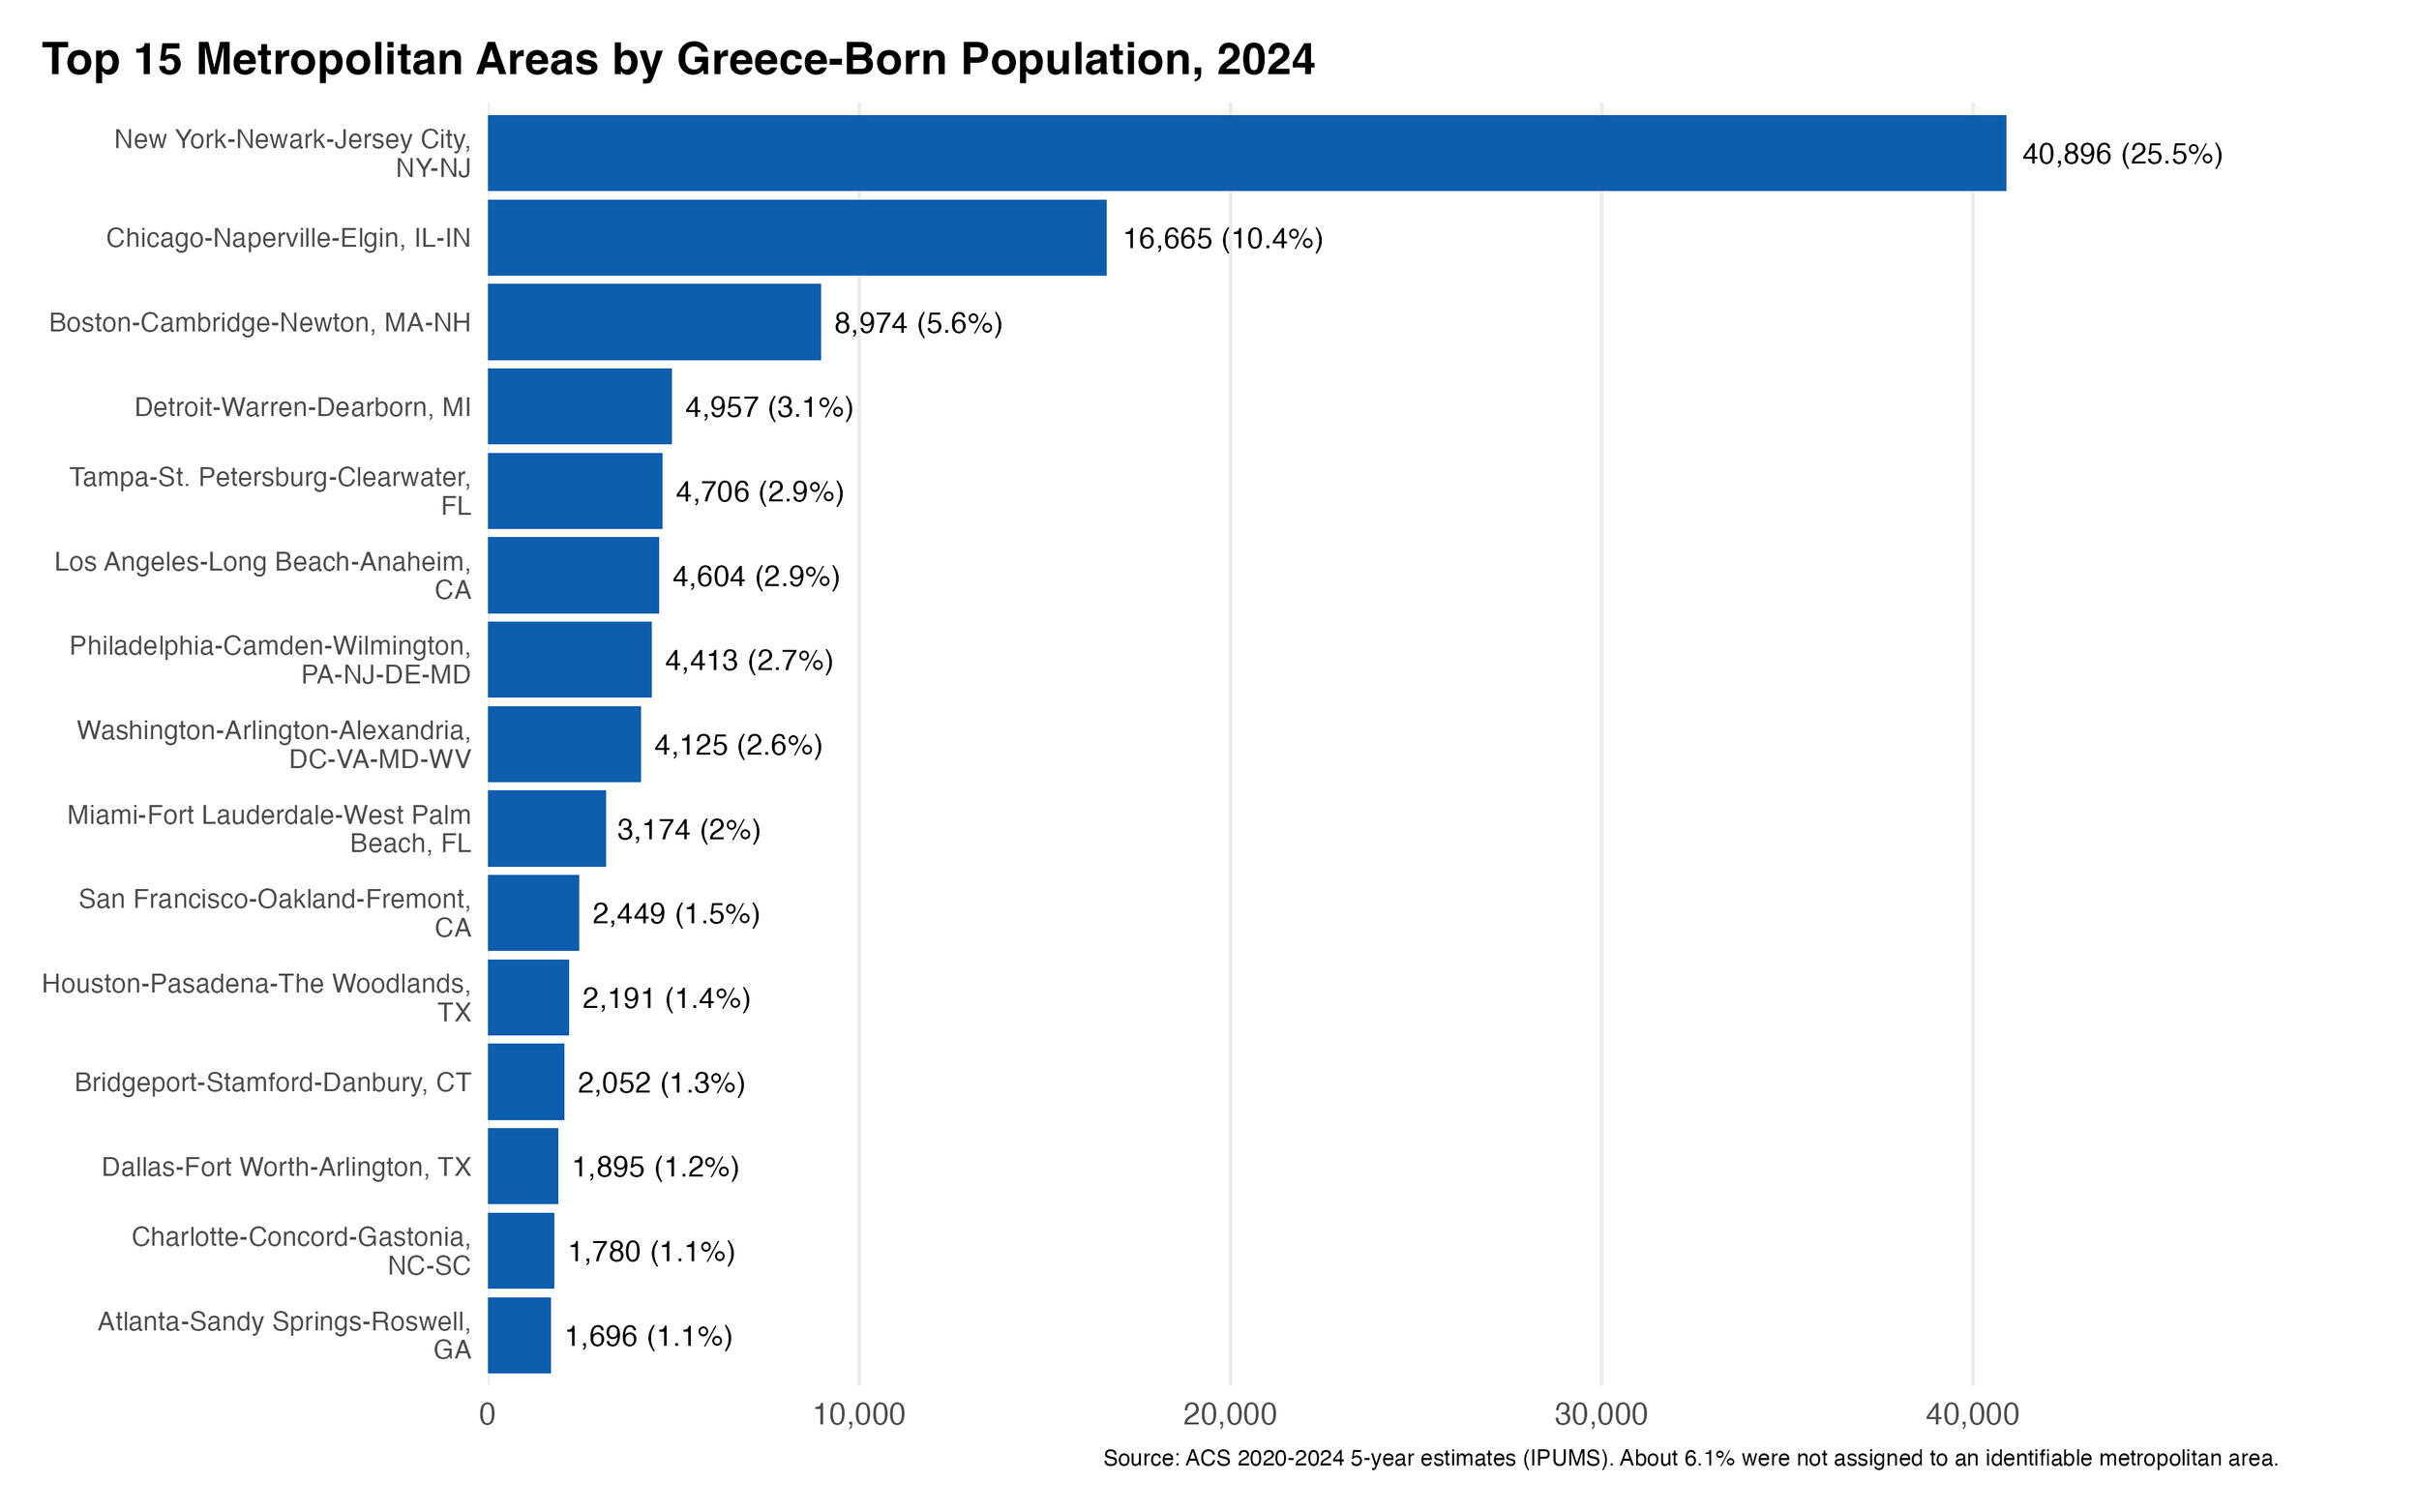
Figure 3: Top 15 Metropolitan Areas by Greece-Born Population, 20204
3. Length of Residence and Assimilation
This section examines three indicators of settlement and integration among Greece-born individuals: years in the United States, citizenship status, and English proficiency. These measures are compared with the broader foreign-born population.
Years in the United States
Most Greece-born individuals have lived in the United States for many years. In 2024, approximately 73.1% of Greece-born immigrants had lived in the United States for 21 years or more, compared to 51.5% of other foreign-born individuals.
Fewer Greece-born individuals had lived in the United States for shorter time periods. About 5.0% had lived in the United States for 16–20 years, 5.7% for 11-15 years, 8.3% for 6-10 years, and 7.9% for 0-5 years. In comparison, the broader foreign-born population had larger shares in each of these more recent arrival categories.
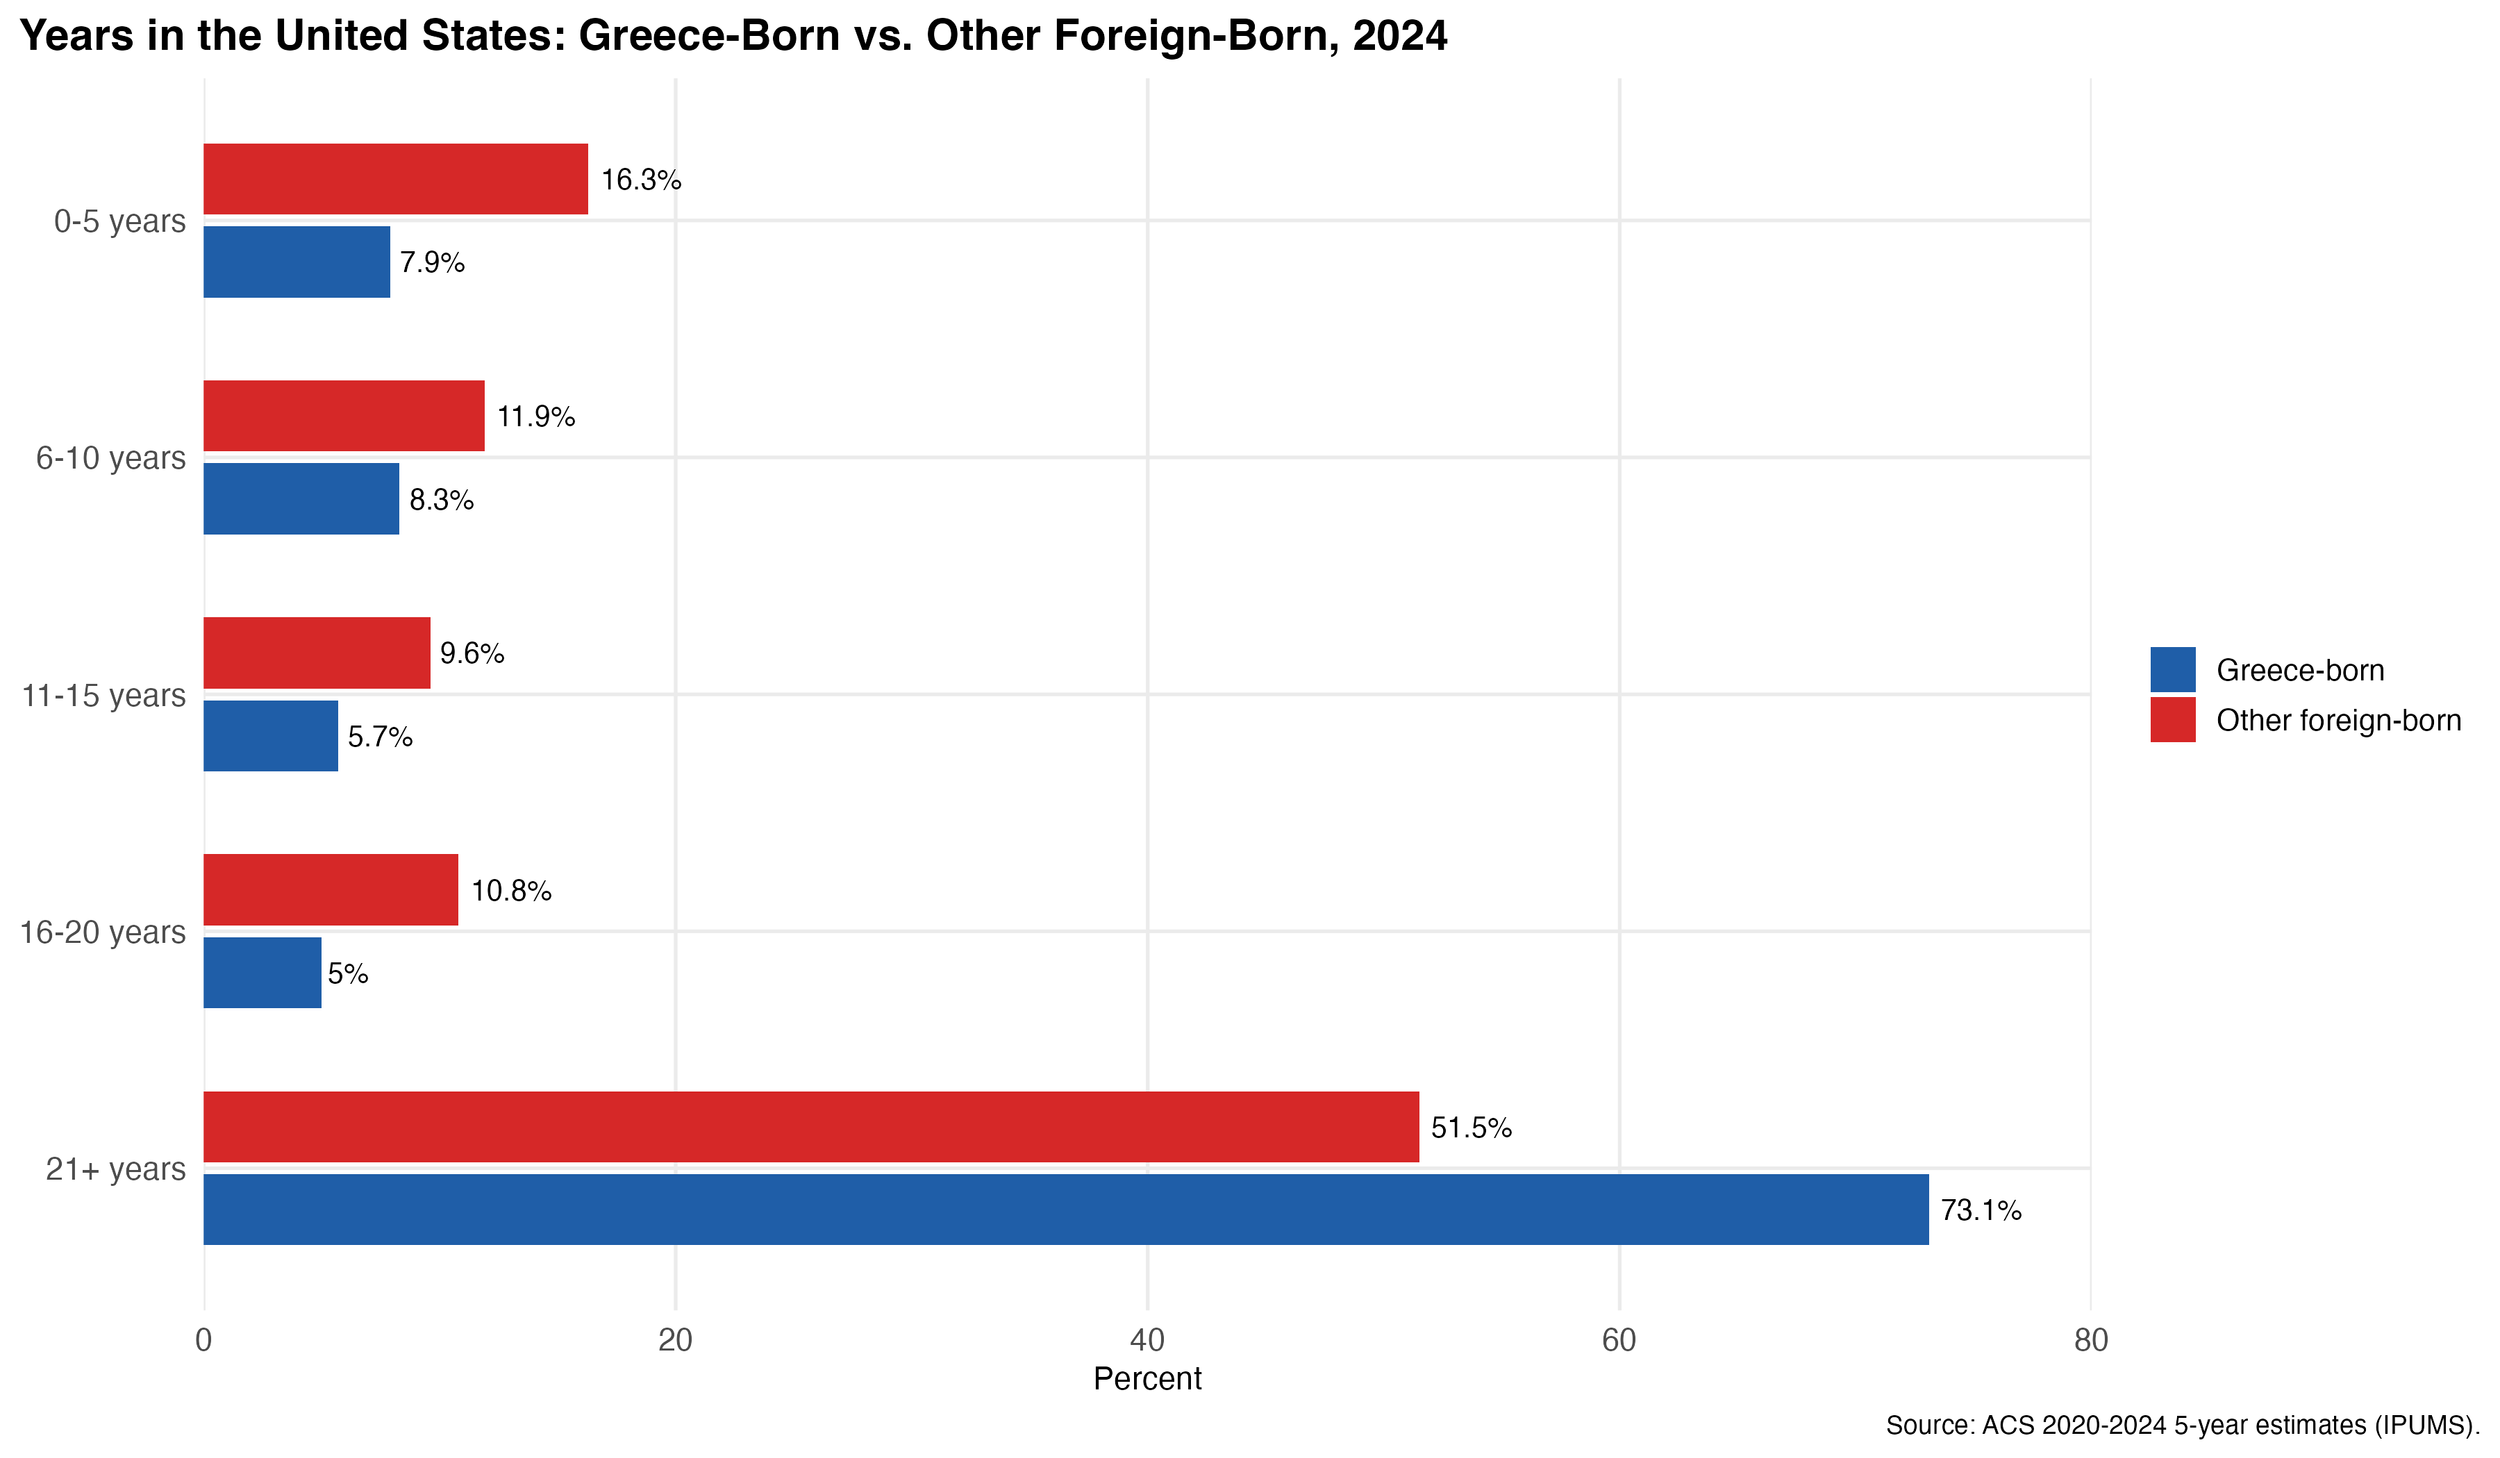
Figure 4: Years in the United States: Greece-Born vs. Other Foreign-Born, 2024
Citizenship
Greece-born individuals are more likely to be naturalized U.S. citizens than the broader foreign-born population. In 2024, approximately 79% of Greece-born individuals were naturalized U.S. citizens, compared to 56% of other foreign-born individuals.
In contrast, 21.2% of Greece-born individuals were not U.S. citizens, compared to 44.3% of the broader foreign-born population.
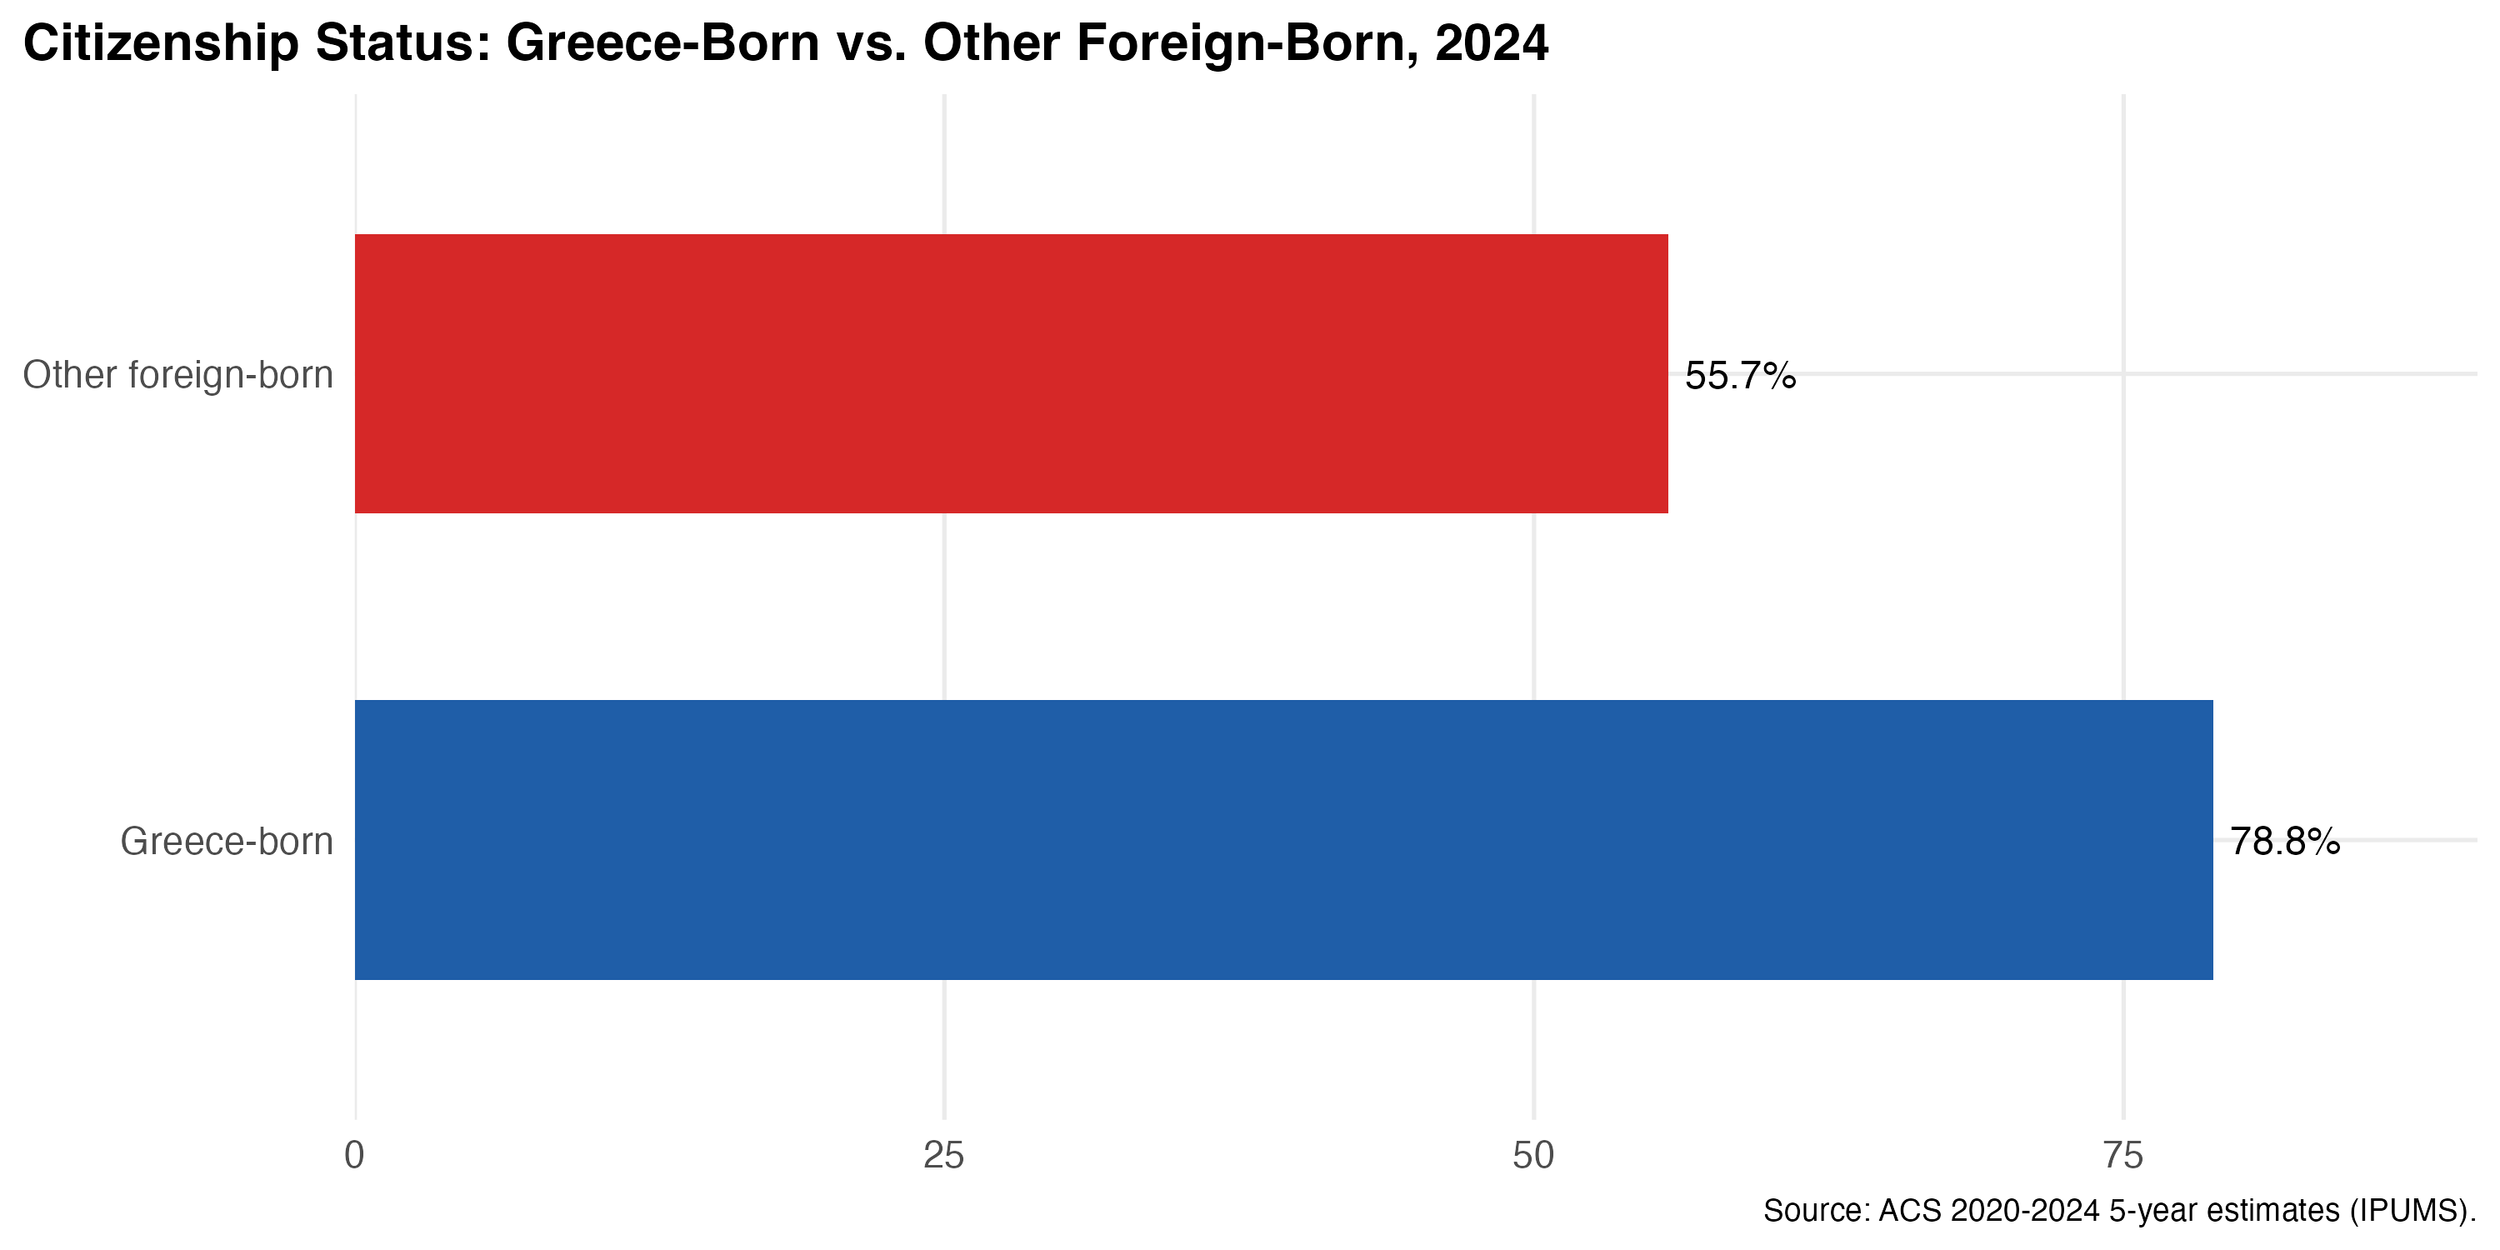
Figure 5: Citizenship Status: Greece-Born vs. Other Foreign-Born, 2024
English Proficiency
Greece-born individuals also report relatively high levels of English proficiency. In 2024, 68.8% of Greece-born individuals reported speaking English “very well” or “well,” compared to 56.1% of other foreign-born individuals.
About 20.2% of Greece-born individuals reported speaking only English at home, similar to the share among the broader foreign-born population (20.2%). The difference between the two groups is not statistically significant.
A smaller share of Greece-born individuals reported speaking English “not well” or “not at all” (11.0%), compared to 23.6% of other foreign-born individuals.
It should be noted that a majority of Greeks born in Greece continue to speak Greek at home (data not shown). In 2024, approximately 61% of Greece-born individuals reported speaking Greek at home. This represents a decline from earlier decades. In 1980, about 88% of Greeks born in Greece reported speaking Greek at home. Using the 2010 ACS 5-year IPUMS data, this share declined to 68.2%.
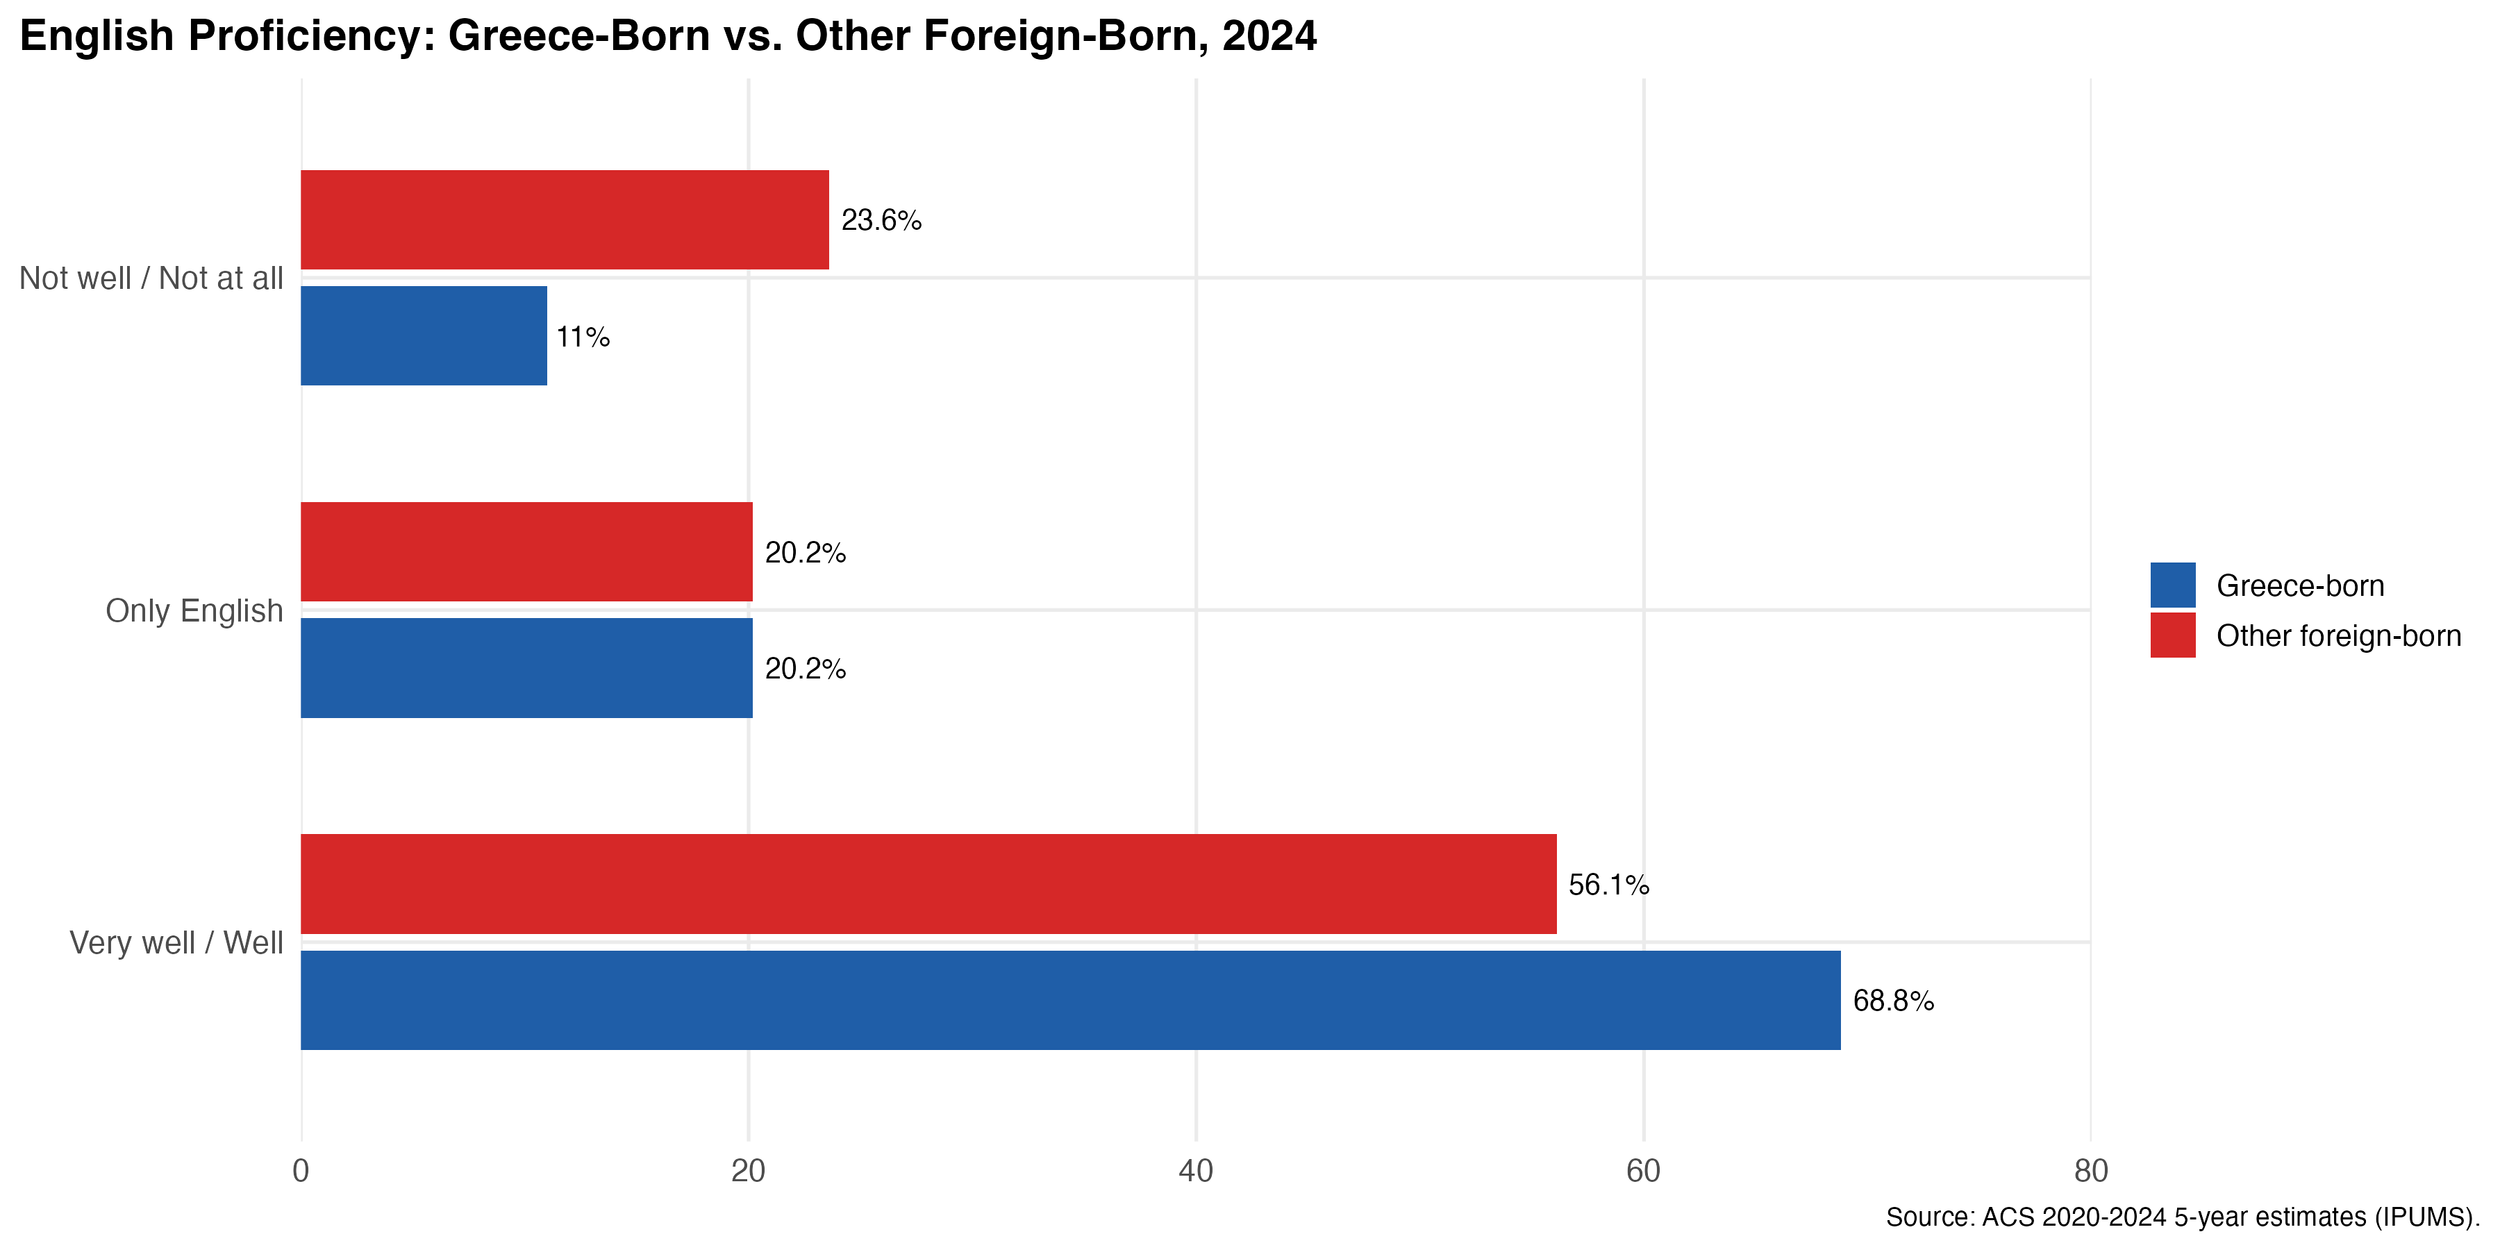
Figure 6: English Proficiency: Greece-Born vs. Other Foreign-Born, 2024
4. Demographic Characteristics
Age
The Greece-born population in the United States is, on average, older than both the native-born and the broader foreign-born populations. In 2024, 42.3% of Greece-born individuals were age 65 and over, compared to 17.2% of the native-born population and 17.1% of other foreign-born individuals.
In contrast, only 2.5% of Greece-born individuals were under age 18, compared with 24.7% of the native-born population and 7.3% of other foreign-born individuals. Among working-age adults (ages 18-64), 55.2% of Greece-born individuals fell into this category, compared to 58.1% of the native-born population and 75.6% of other foreign-born individuals.
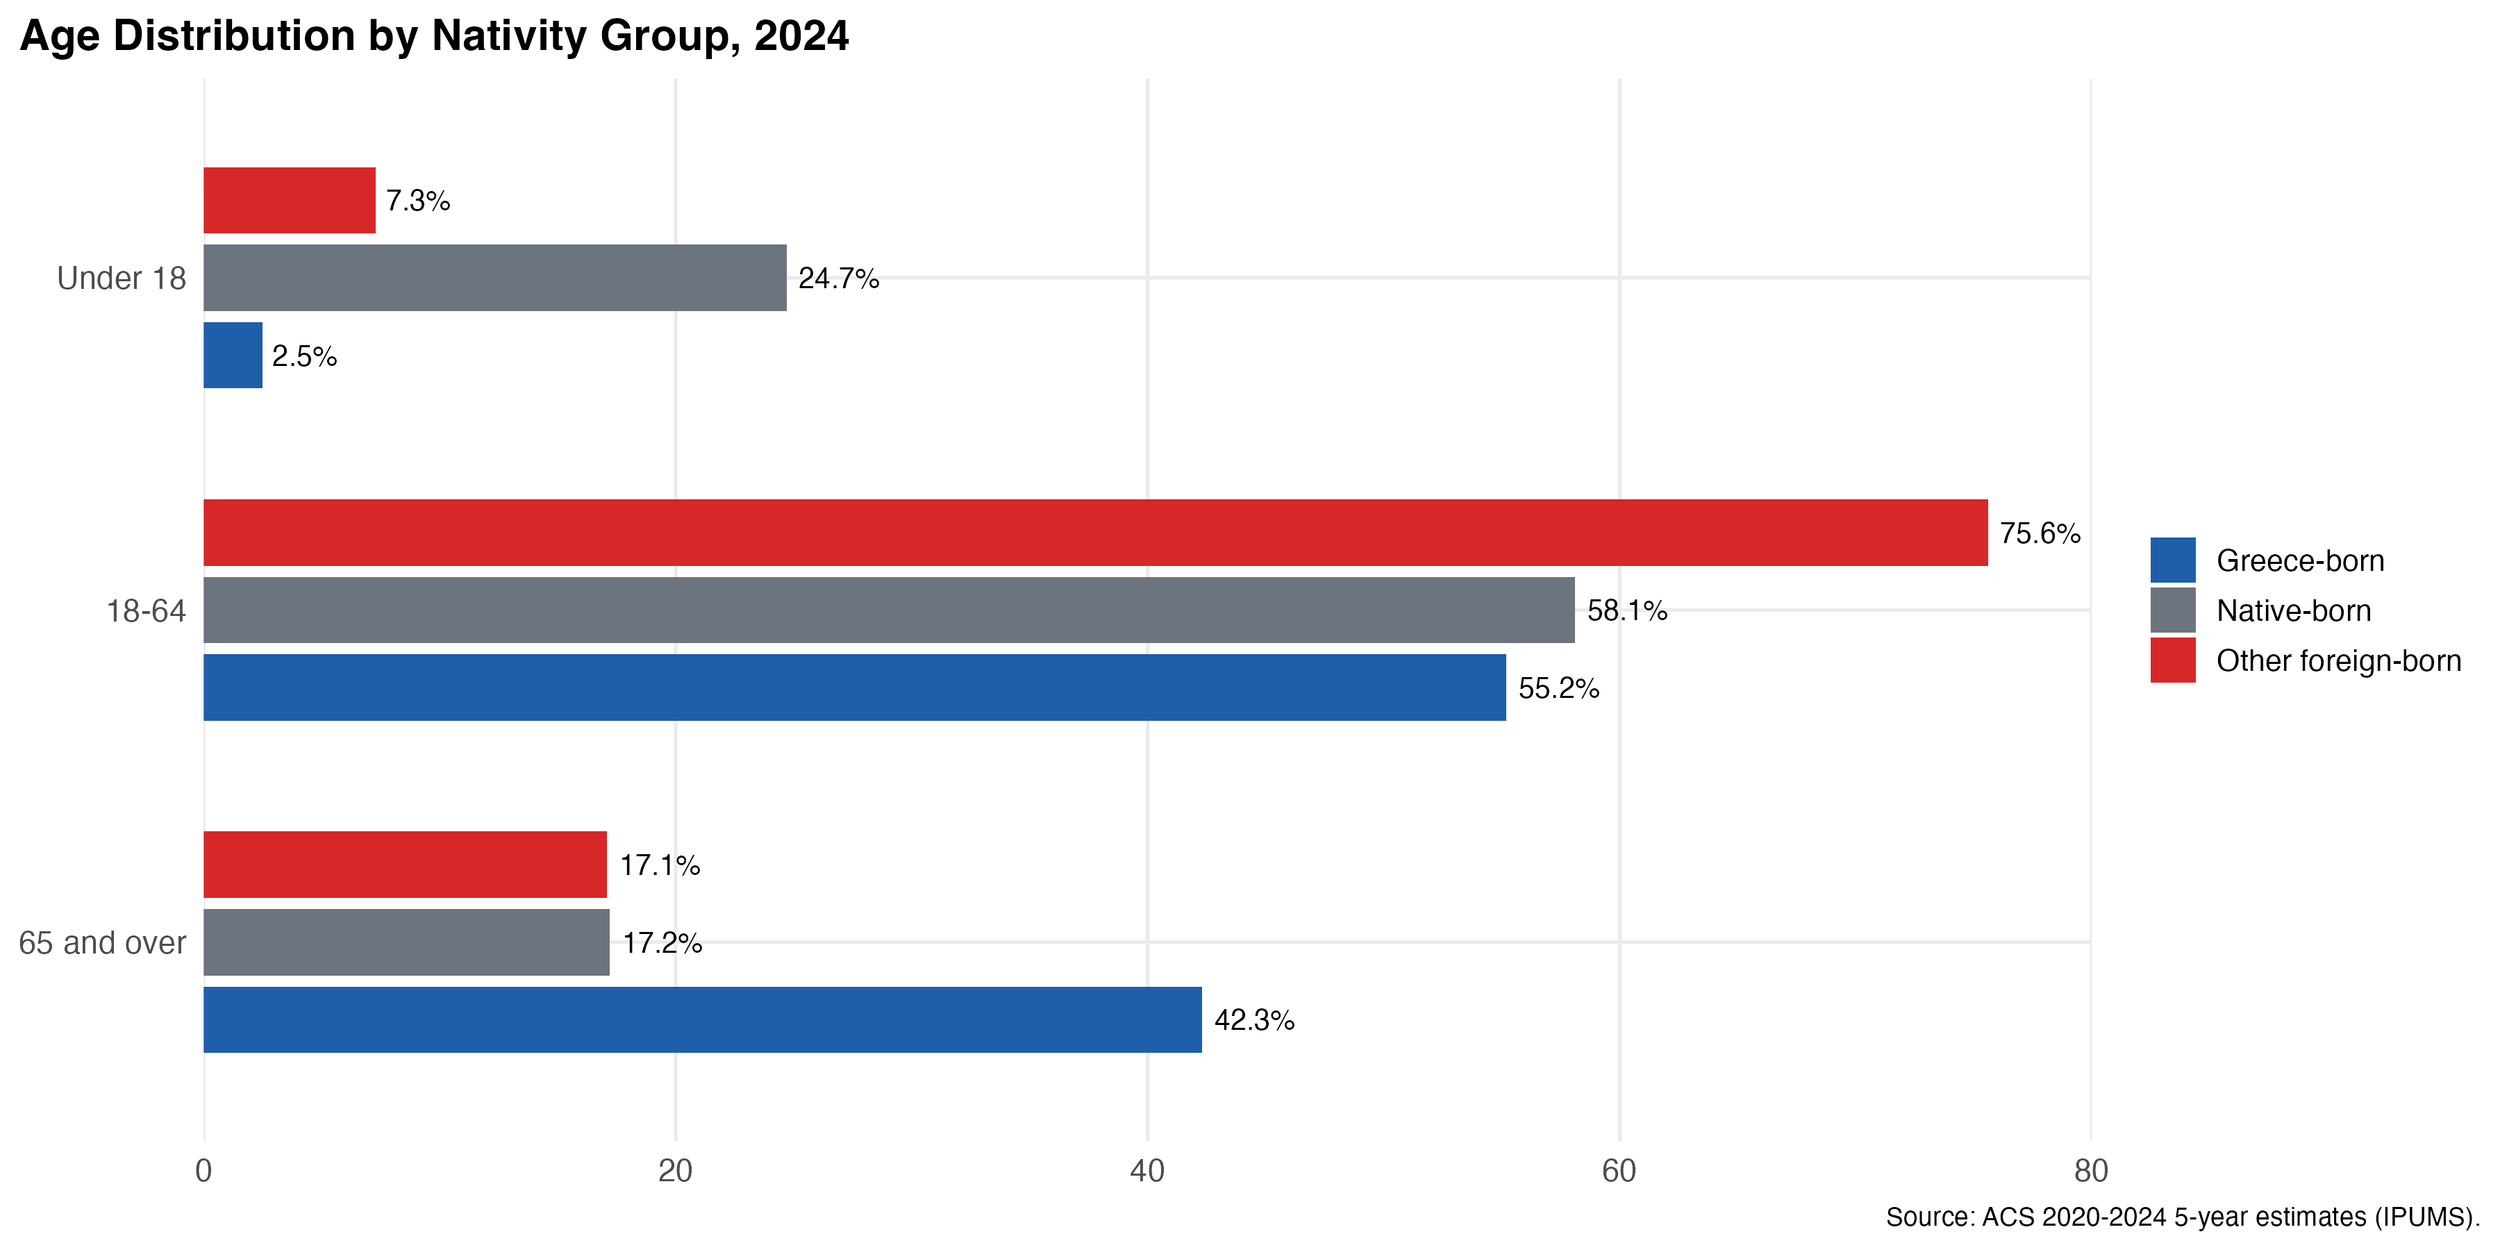
Figure 7: Age Distribution by Nativity Group, 2024
Sex (data not shown)
The Greece-born population is slightly more male than female. In 2024, 52.6% of Greece-born individuals were male, and 47.4% were female.
By comparison, the broader foreign-born population was 49.0% male and 51.0% female, while the native-born population was 49.6% male and 50.4% female.
Age–Sex Structure
The age–sex population structure further illustrates the older age distribution of the Greece-born population. The Greece-born population shows a larger concentration at older ages, especially among individuals aged 60 and over, compared to both the native-born and other foreign-born populations.
Meanwhile, the native-born population shows a more even distribution across age groups, with larger shares at younger ages. The broader foreign-born population shows a greater concentration in working-age groups, particularly among those aged 25 to 54.
Overall, the age–sex pyramid highlights clear differences in age structure across the three groups, with the Greece-born population more heavily concentrated at older ages and smaller shares at younger ages.
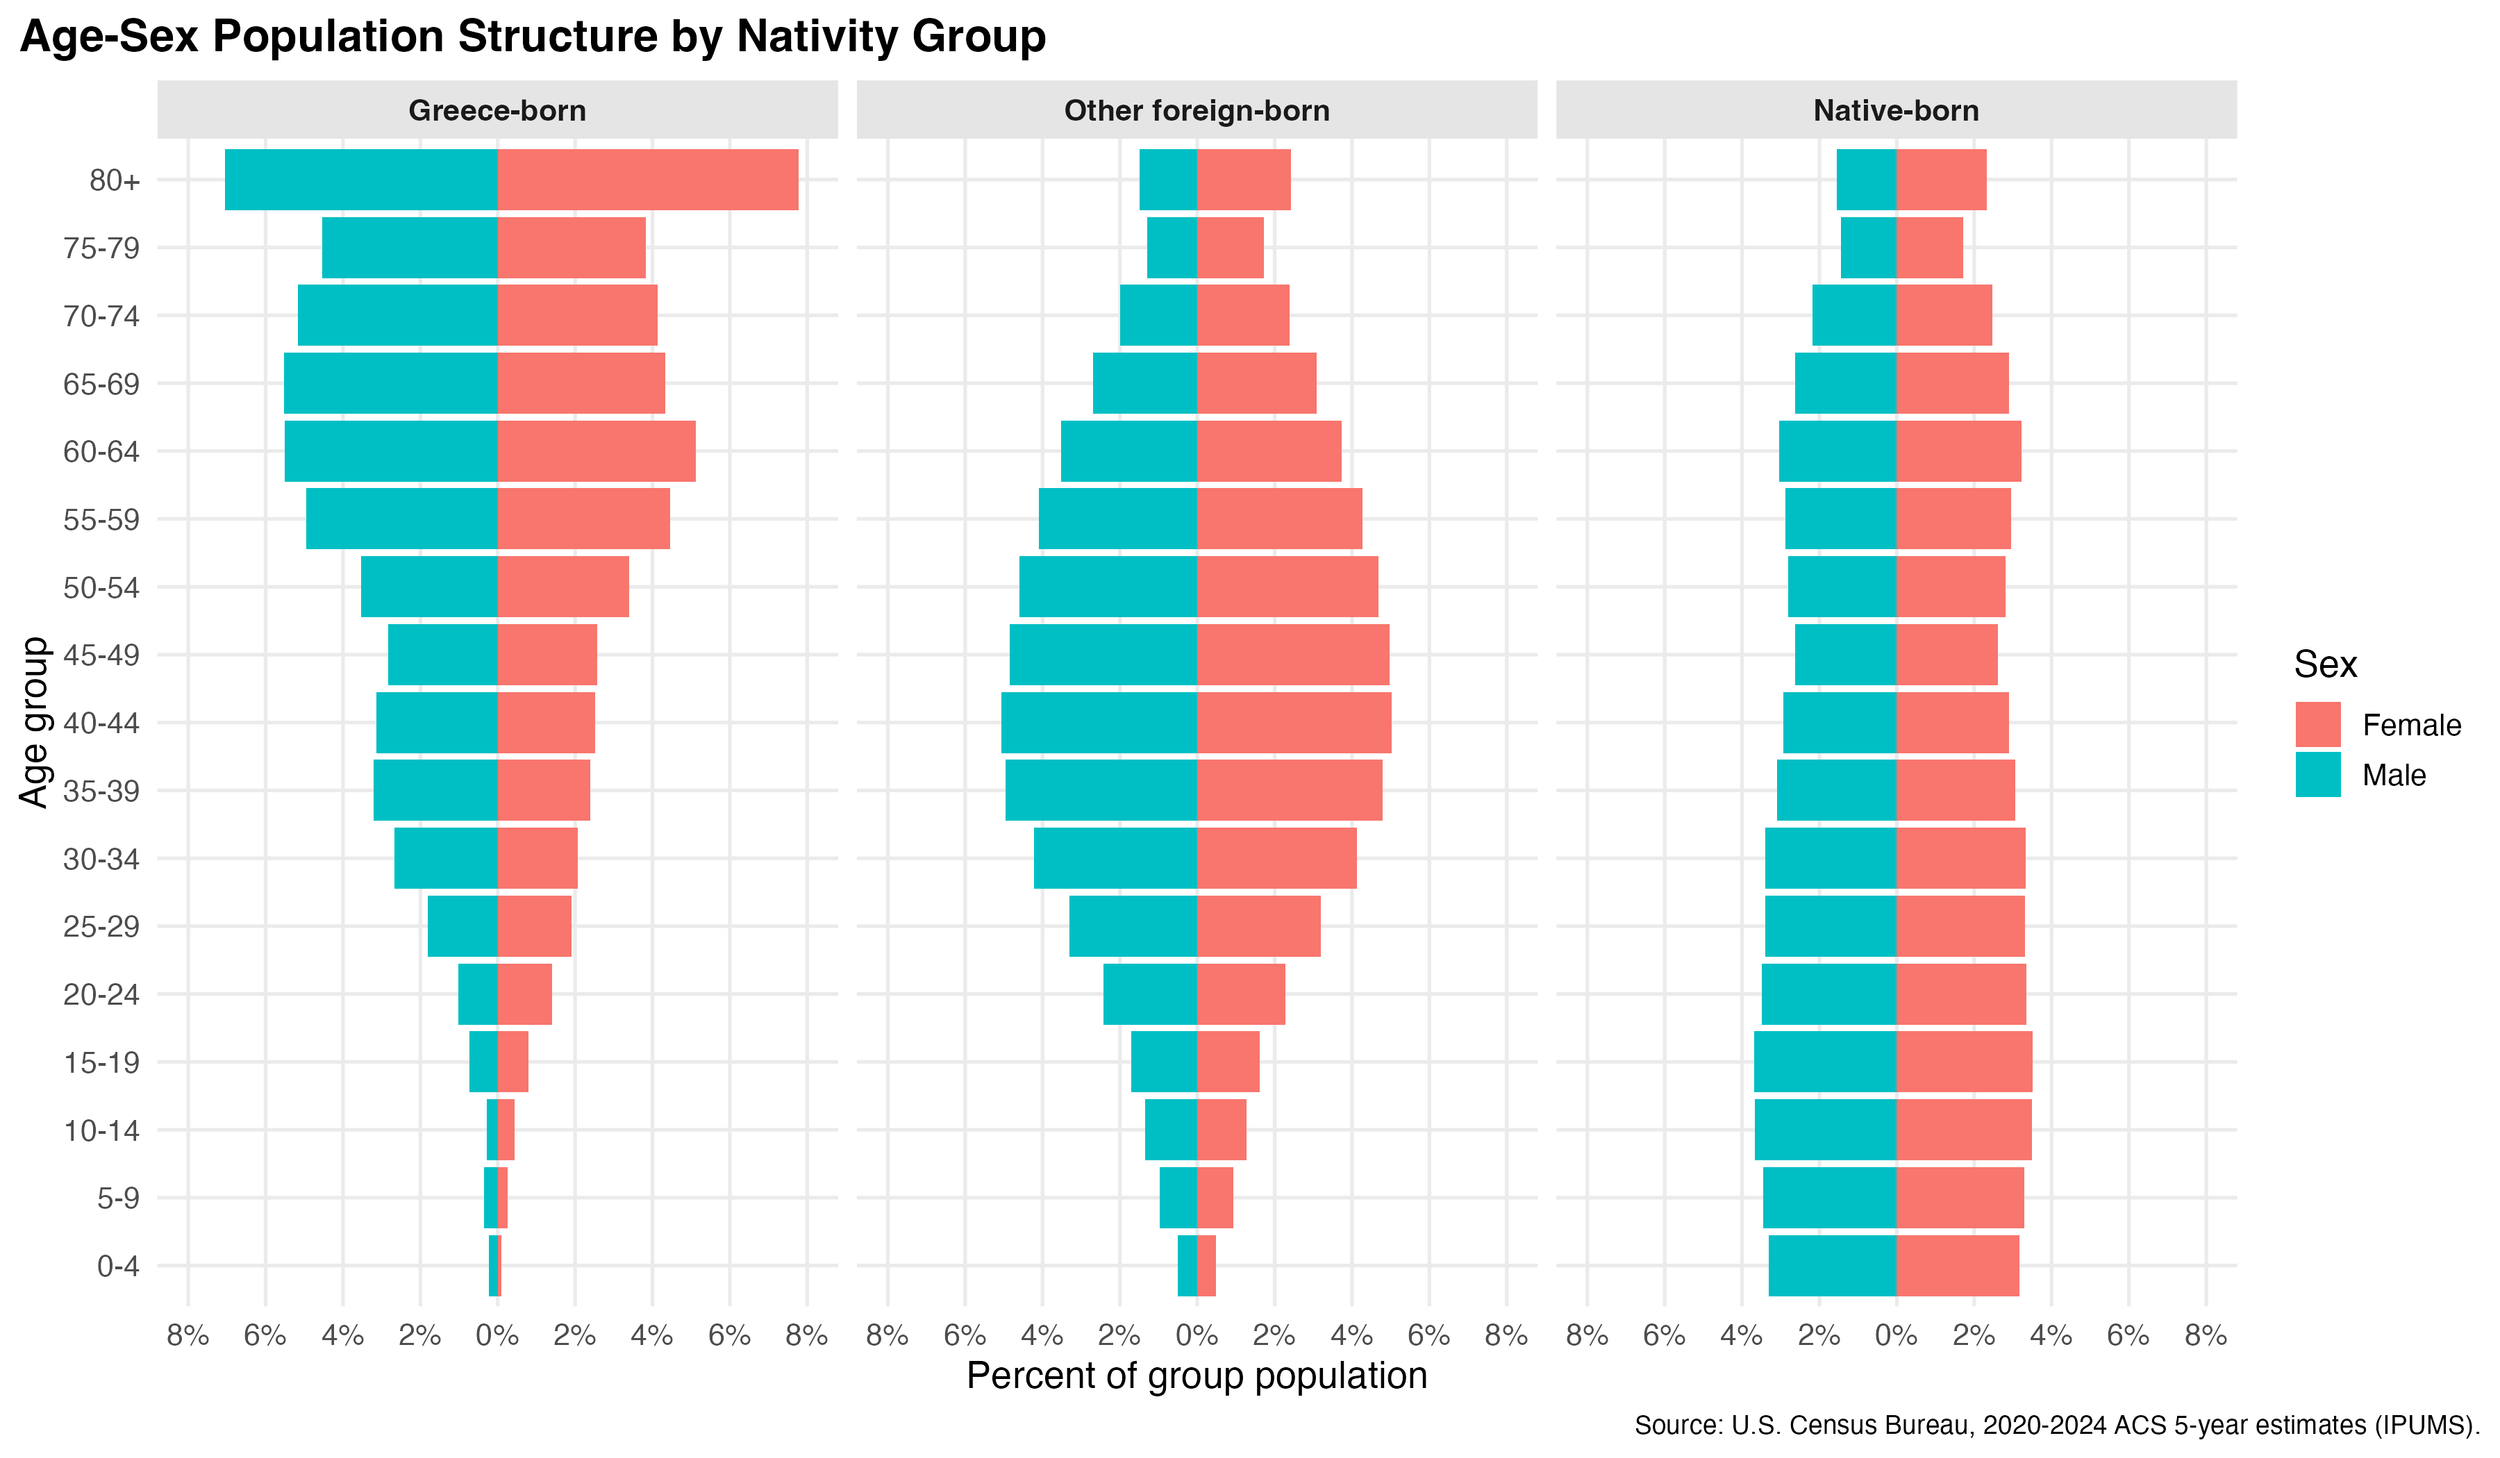
Figure 8: Age-Sex Population Pyramin by Nativity Group
5. Socioeconomic Characteristics
Education
Greece-born individuals report relatively high levels of educational attainment compared to both the native-born and broader foreign-born populations. In 2024, 34.7% of Greece-born individuals had a bachelor’s degree or higher, compared to 24.8% of the native-born population and 31.0% of other foreign-born individuals.
About 25.7% of Greece-born individuals reported a high school diploma as their highest level of education, compared to 21.3% of both the native-born and other foreign-born populations. Meanwhile, 16.8% of Greece-born individuals reported having some college education, compared to 23.7% of the native-born and 18.8% of other foreign-born individuals.
Finally, 22.8% of Greece-born individuals reported less than a high school education, compared to 30.2% of the native-born population and 28.9% of other foreign-born individuals.
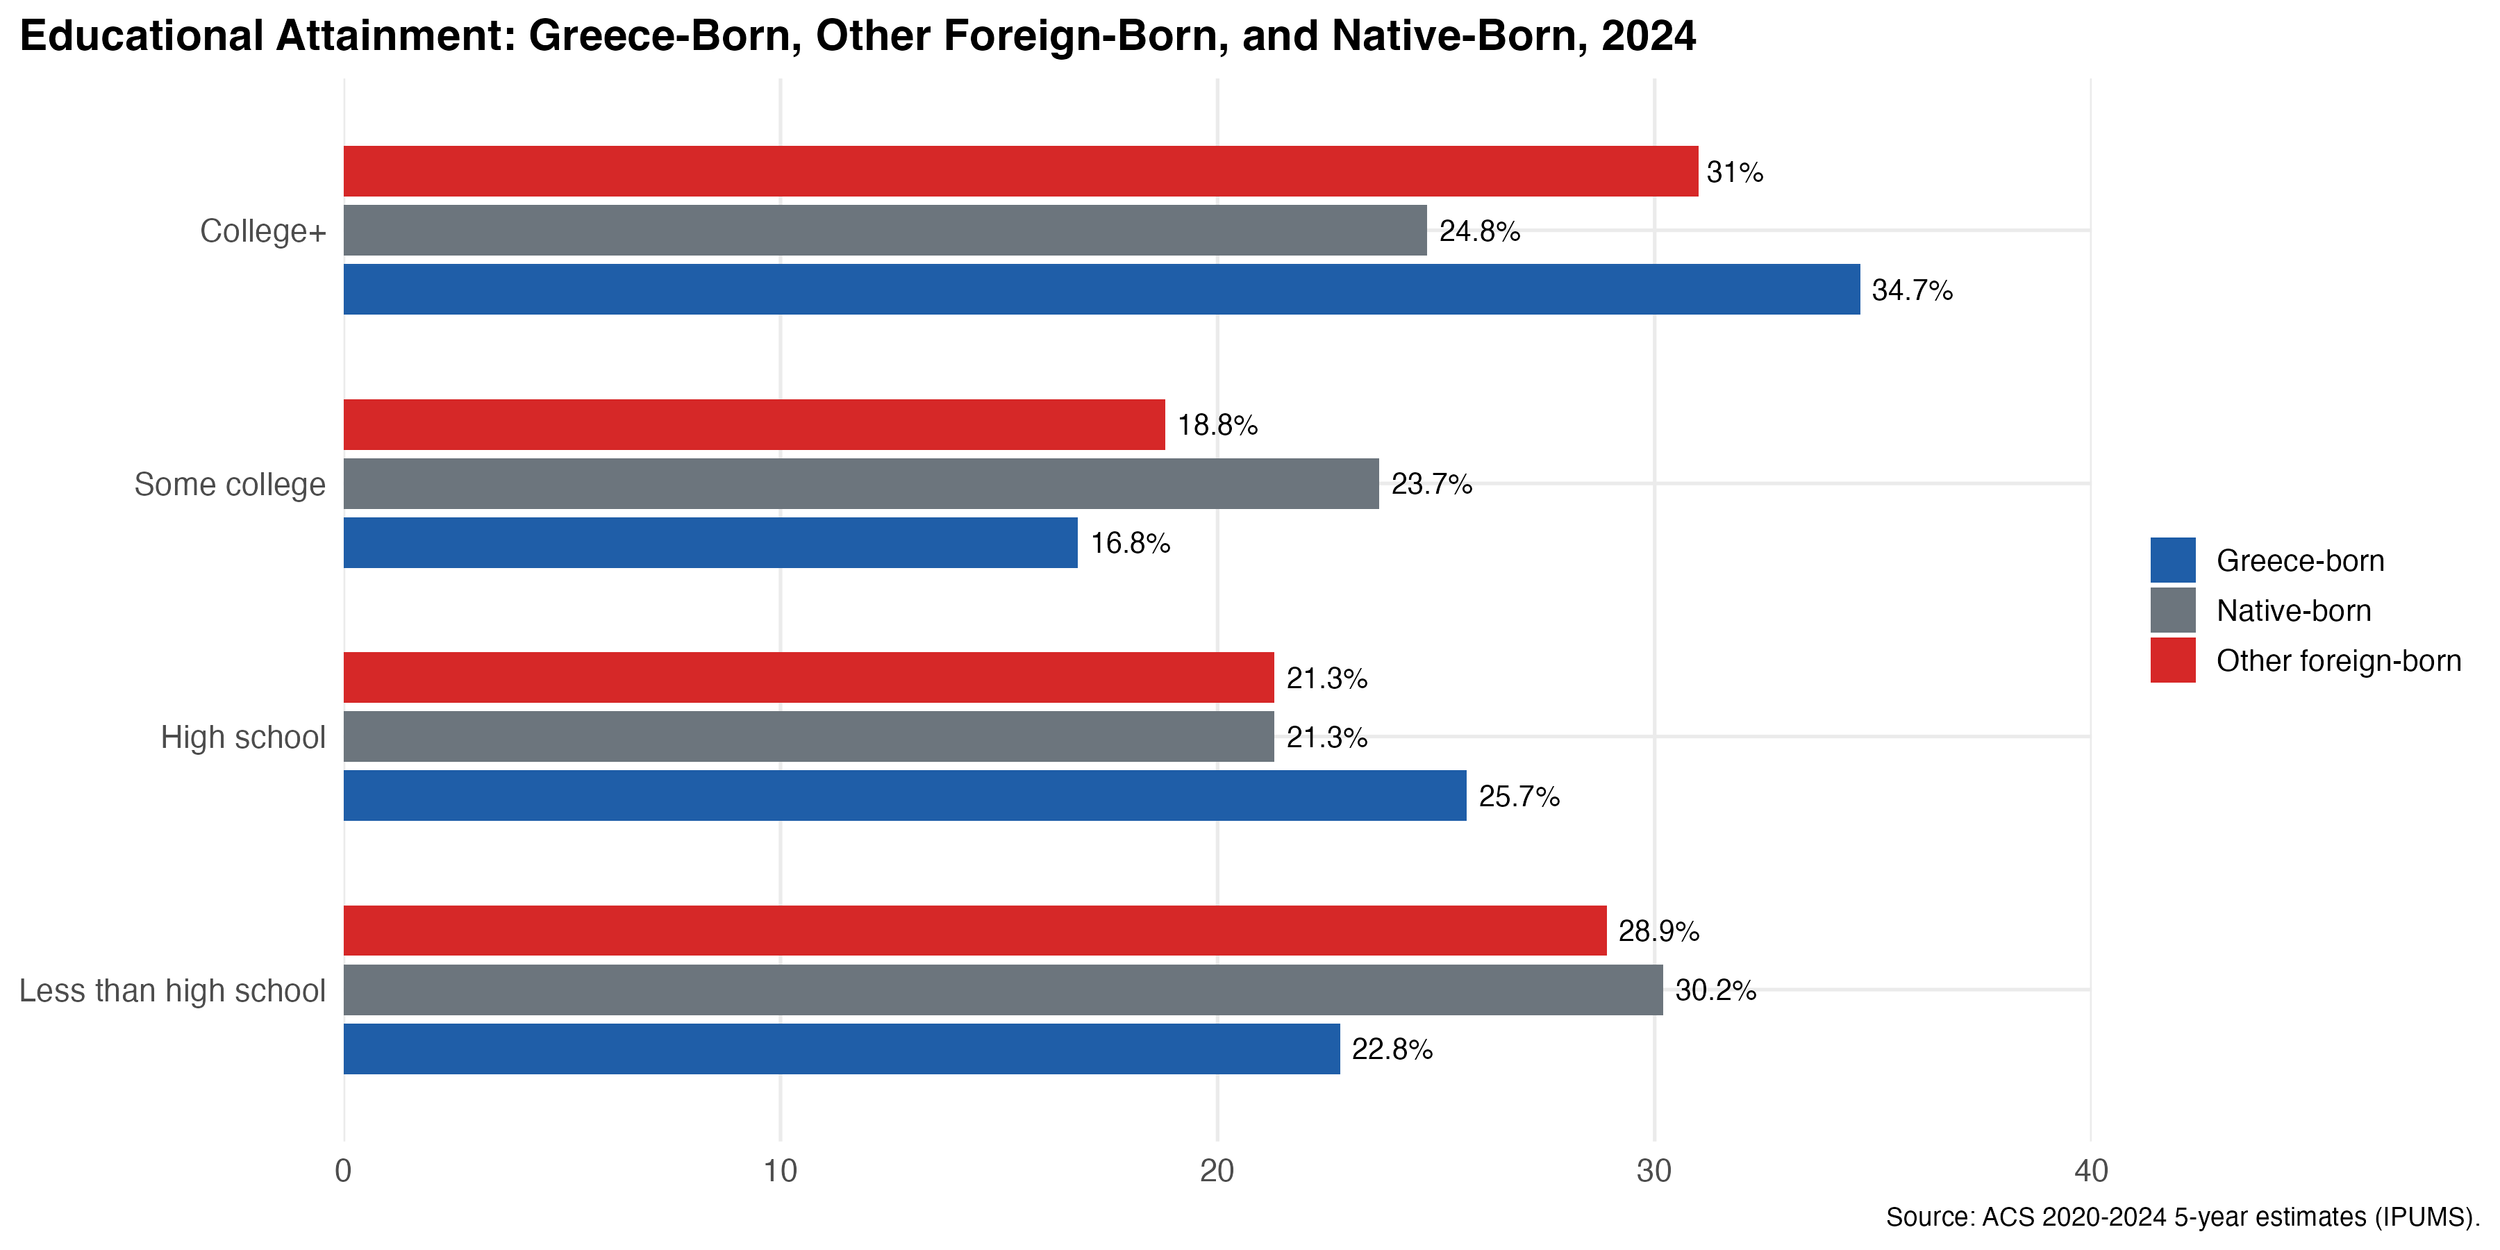
Figure 9: Educational Attainment: Greece-Born, Other Foreign-Born, and Native-Born, 2024
Occupation
Greece-born individuals are more concentrated in managerial and professional occupations compared to both the native-born and broader foreign-born populations. In 2024, 43.2% of Greece-born individuals worked in managerial and professional occupations, compared to 36.1% of native-born individuals and 31.2% of other foreign-born individuals.
About 22.6% of Greece-born individuals worked in technical, sales, and administrative occupations, compared to 27.2% of native-born individuals and 21.6% of other foreign-born individuals. Service occupations accounted for 17.0% of Greece-born individuals, compared to 15.6% of native-born individuals and 19.7% of other foreign-born individuals.
Smaller shares of Greece-born individuals worked in production, craft, and repair occupations (7.7%) and in operatives and laborer occupations (9.5%), compared with higher shares among other foreign-born individuals.
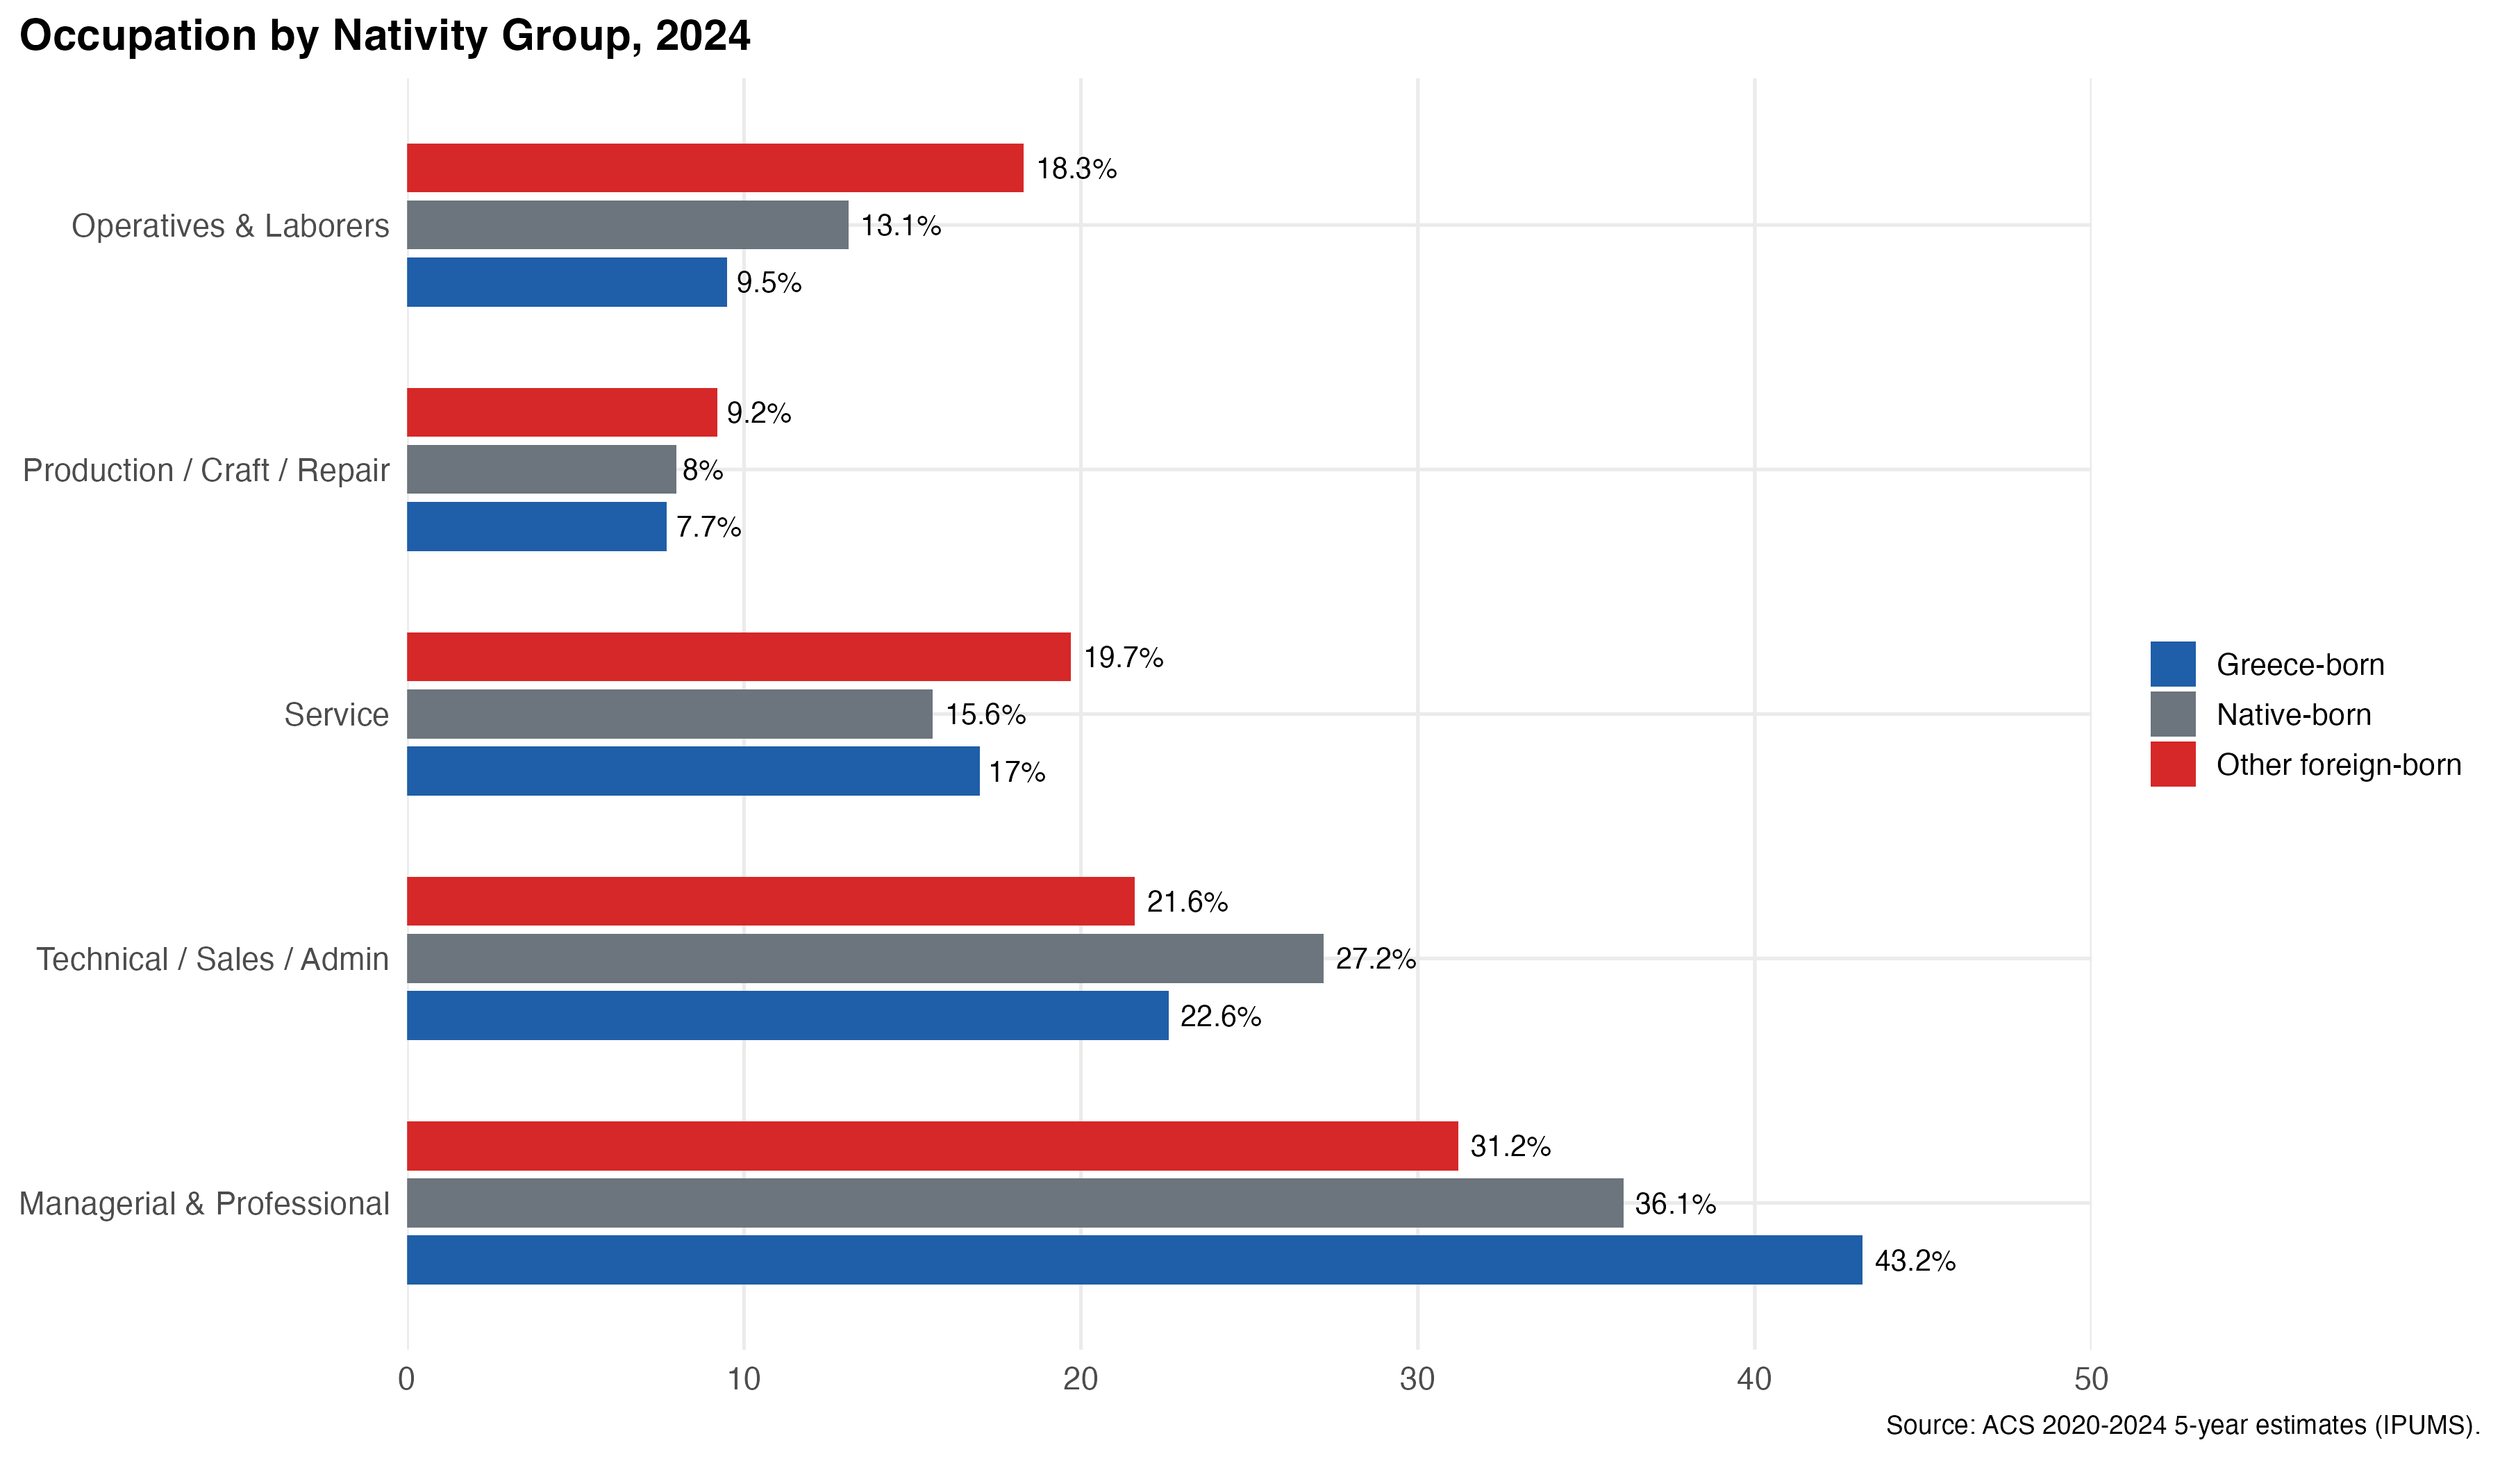
Figure 10: Occupation by Nativity Group, 2024
Median Household Income (data not shown)
Median household income among Greece-born individuals was slightly higher than both comparison groups. In 2024, the median household income for Greece-born individuals was $98,478, compared to $96,466 for native-born households and $93,357 for other foreign-born households.
Poverty
Greece-born individuals reported slightly lower poverty rates than both the native-born and broader foreign-born populations. In 2024, 9.9% of Greece-born individuals were below the poverty line, compared to 10.6% of the native-born population and 12.5% of other foreign-born individuals.
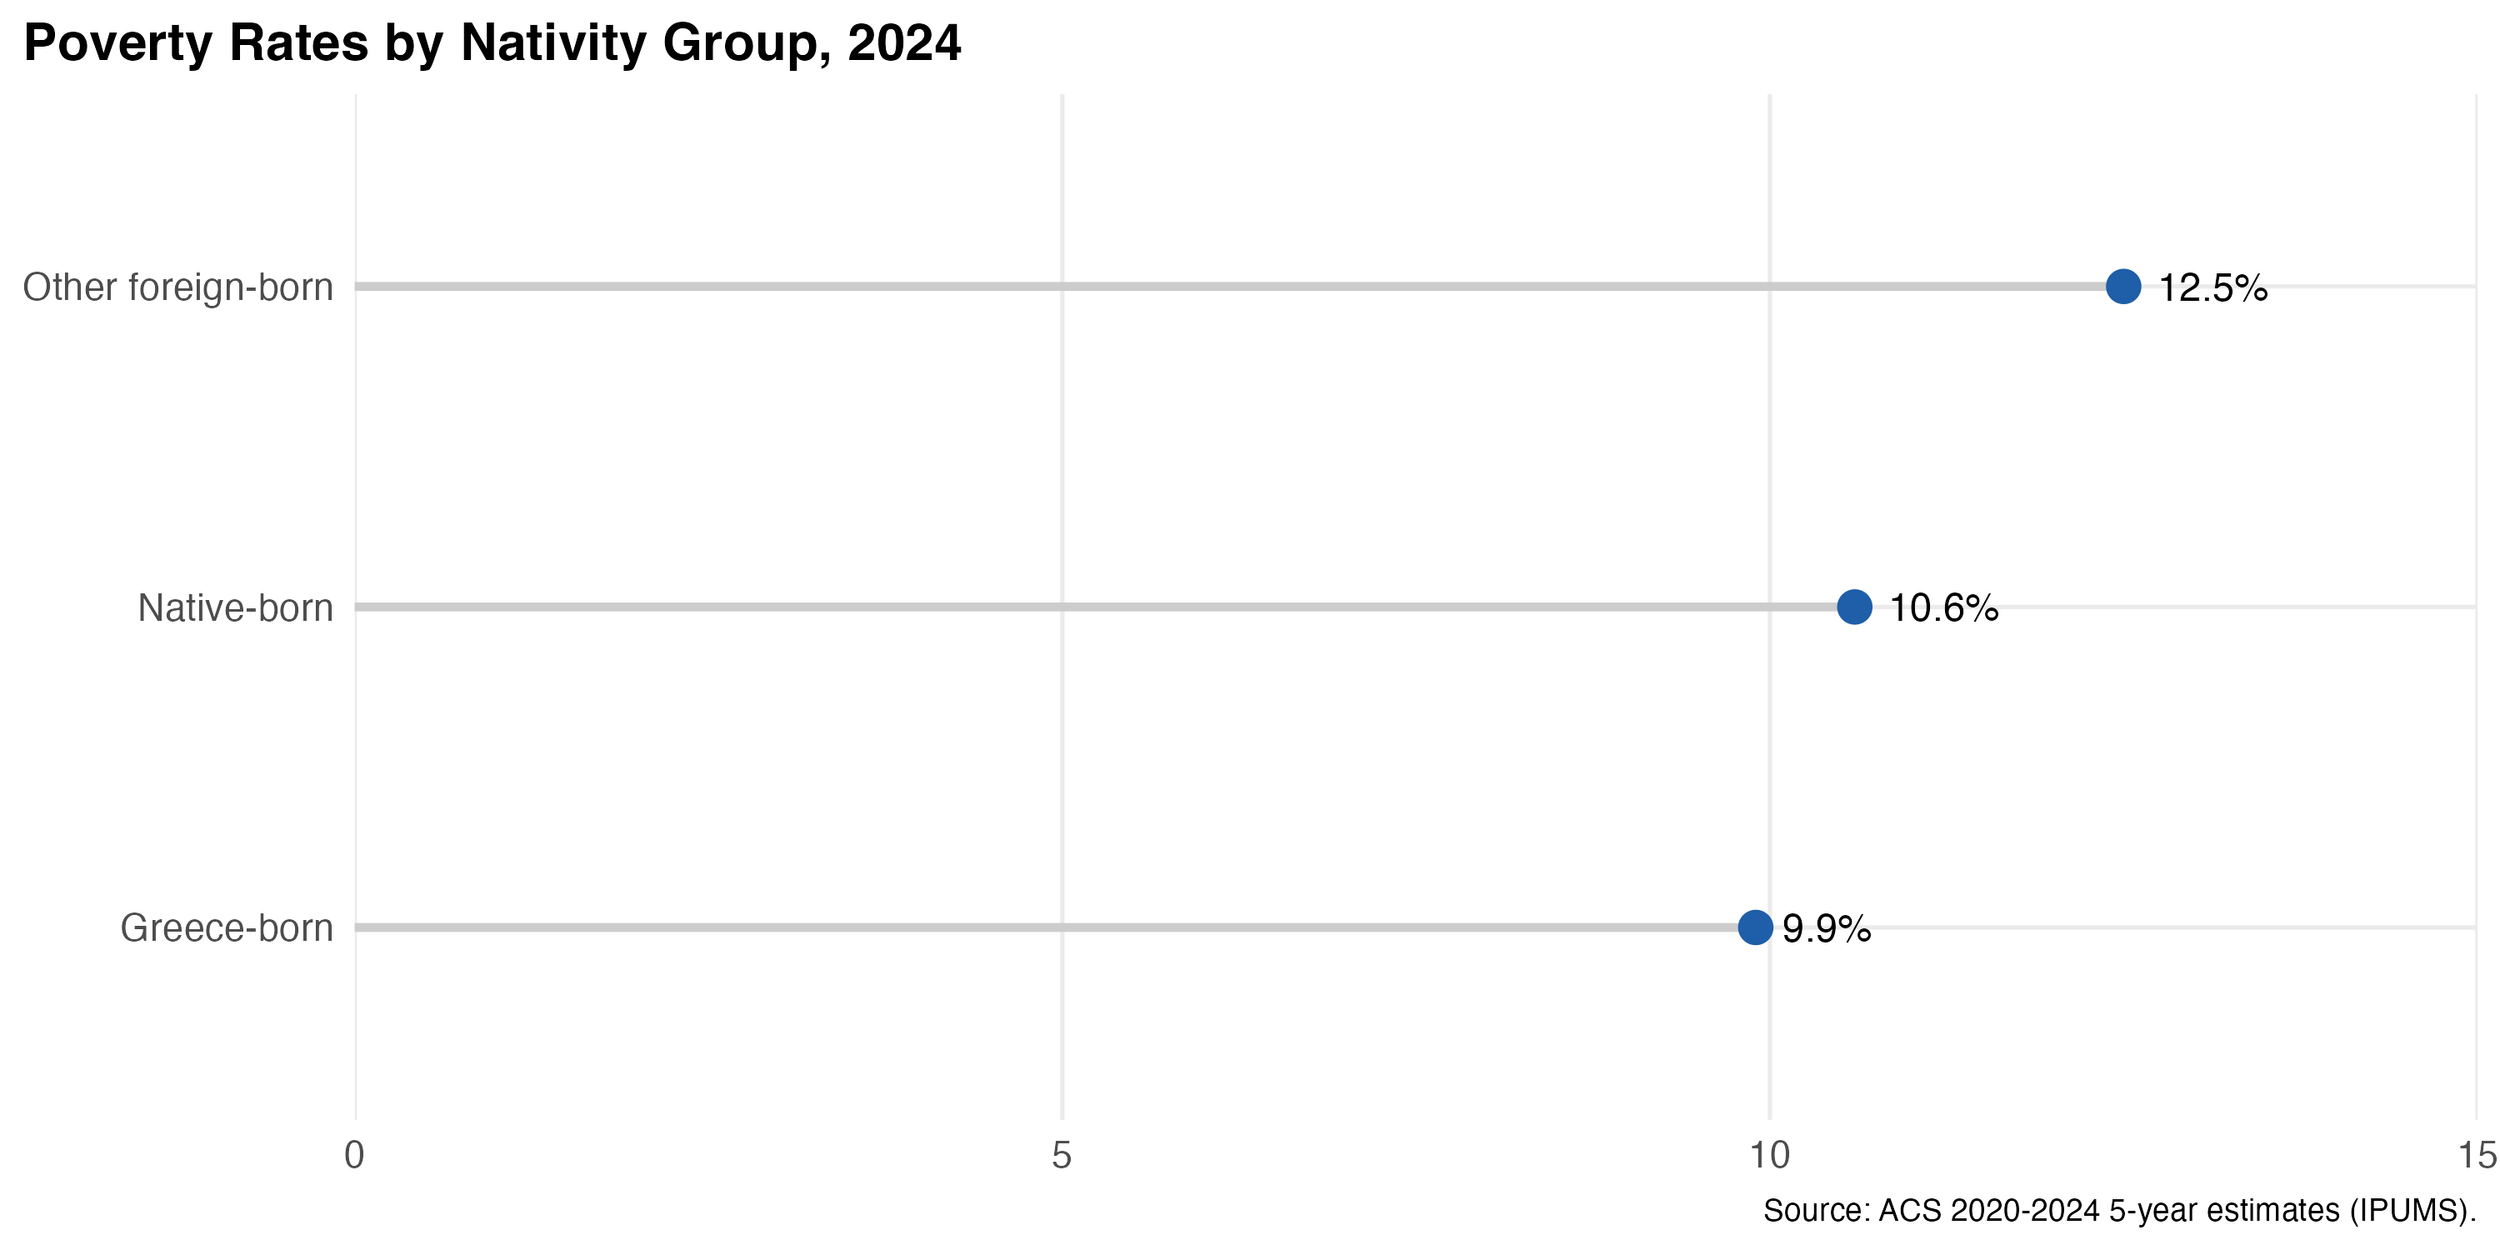
Figure 11: Poverty Rates by Nativity Group, 2024
Health Insurance
Greece-born individuals were less likely than both the native-born and the broader foreign-born populations to lack any form of health insurance. In 2024, 6.3% of Greece-born individuals lacked health insurance coverage, compared to 7.0% of the native-born population and 17.4% of other foreign-born individuals.
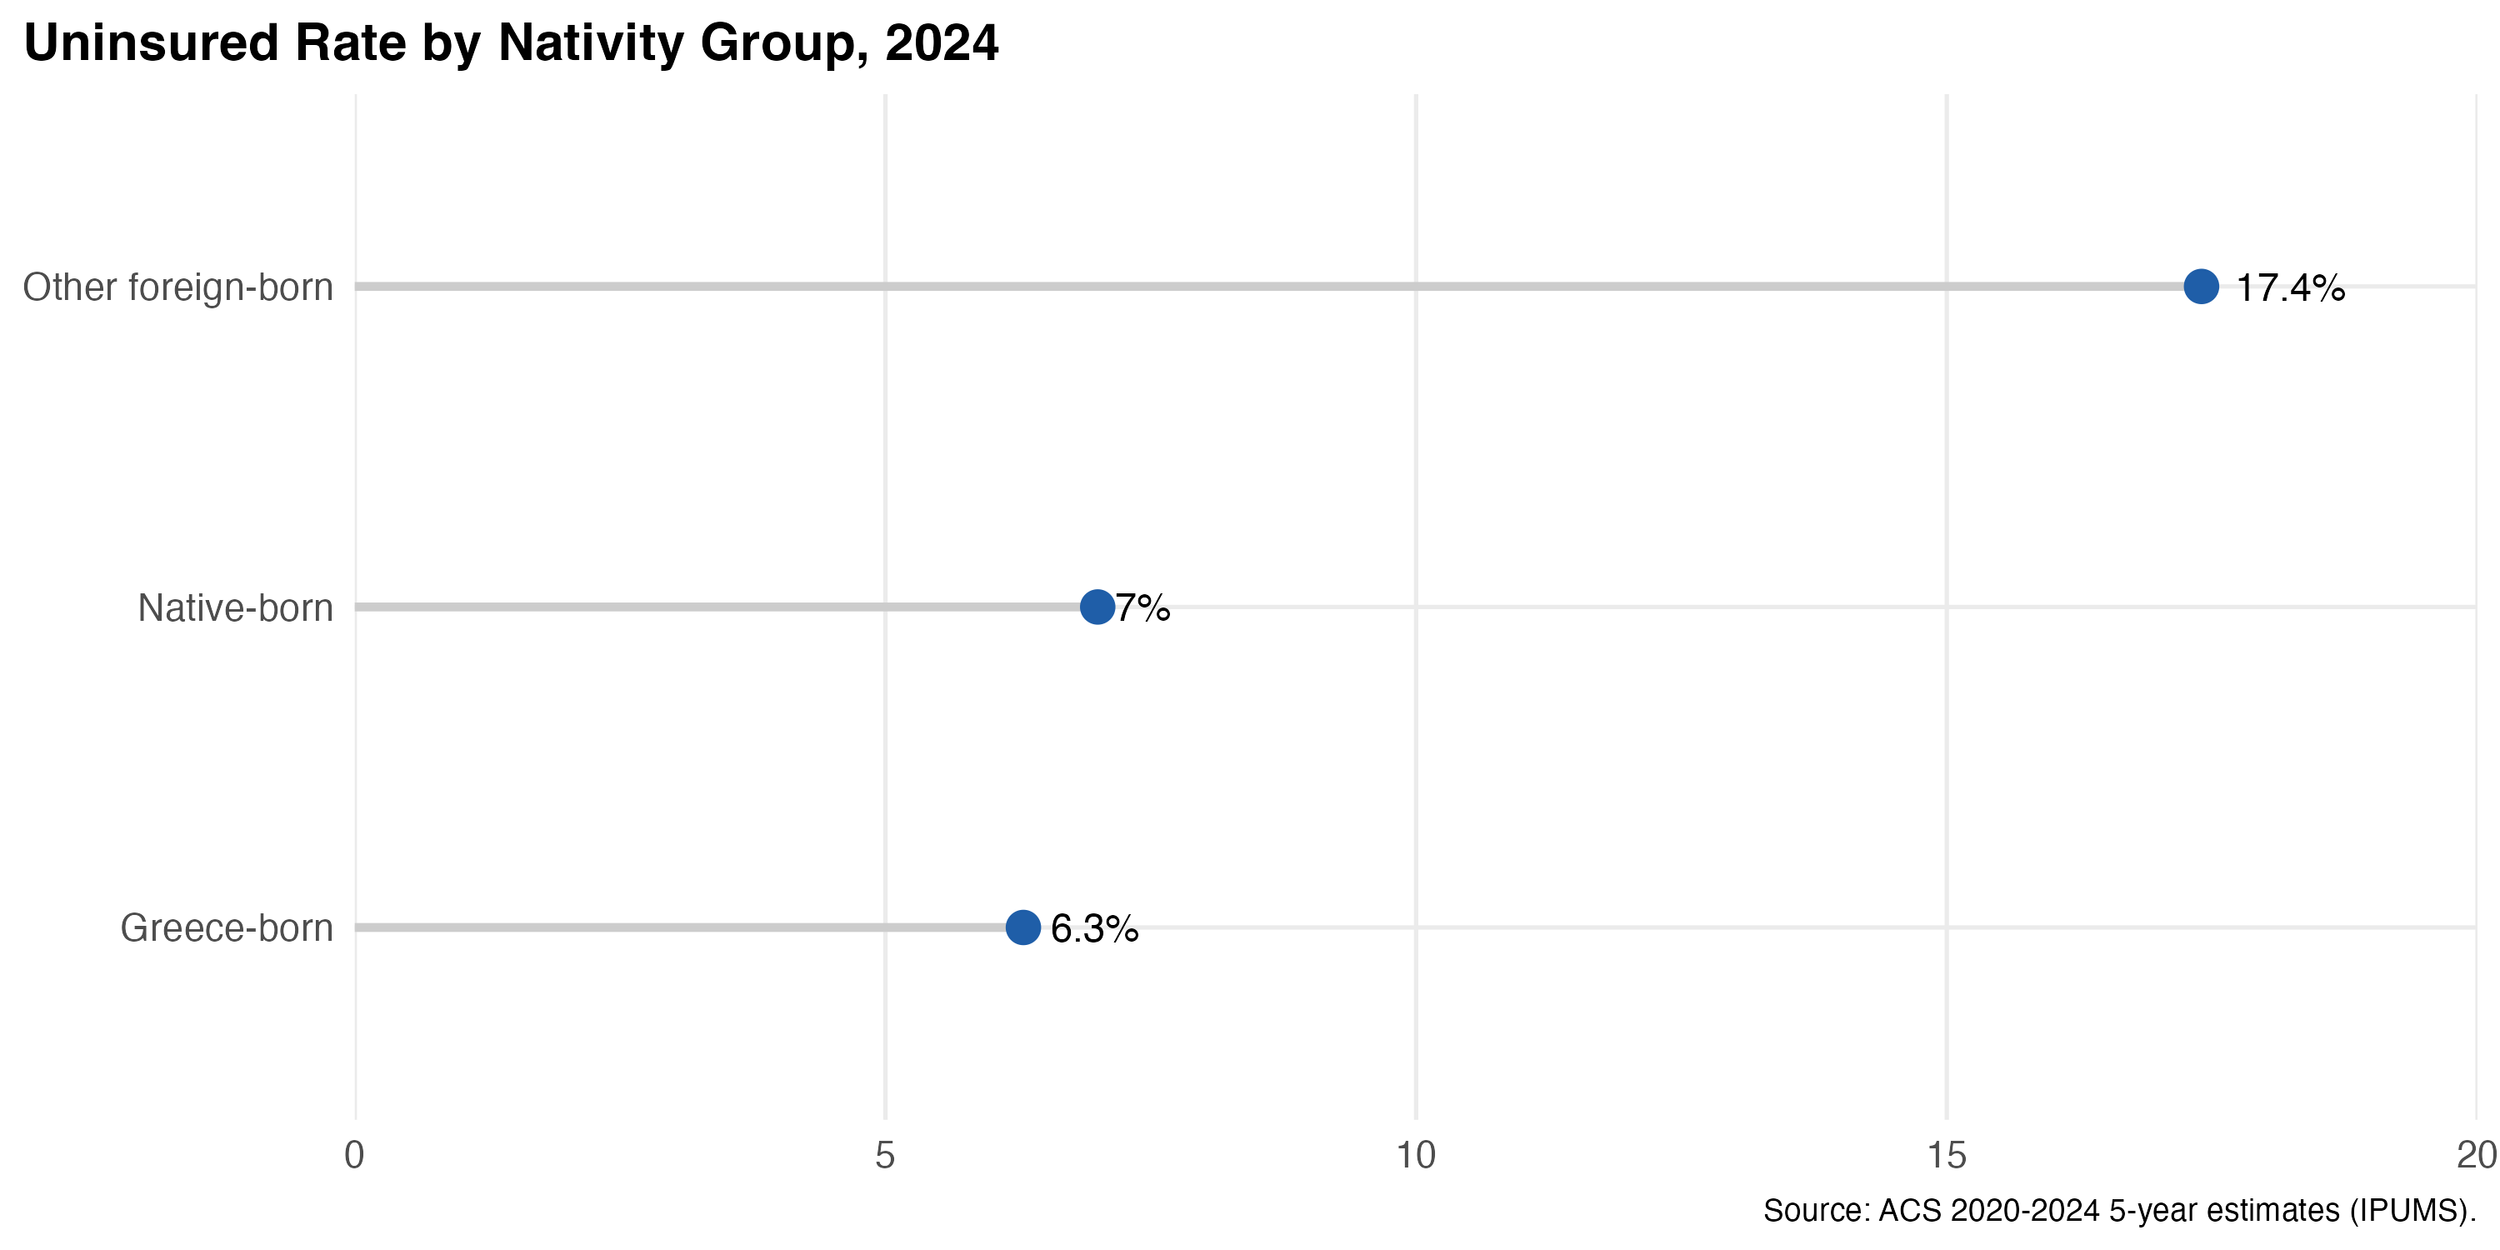
Figure 12: Uninsured Rate by Nativity Group, 2024
6. Top Global Destinations
Globally, 779,000 migrants born in Greece resided outside Greece, according to recent international migration estimates. Greek emigrants are concentrated in a relatively small number of destination countries.
Germany is the largest destination for migrants from Greece, with approximately 243,000 Greece-born individuals, accounting for about 31% of all Greek emigrants worldwide. The United States ranks second with about 131,000 Greece-born migrants (17%), followed by Australia (89,000; 11%), Canada (50,000; 6%), and Turkey (32,000; 4%).
Other significant destinations include the Netherlands (31,000), Albania (28,000), Cyprus (25,000), Sweden (22,000), Belgium (20,000), and Switzerland (19,000). Smaller but still notable Greece-born populations are also found in Italy, Bulgaria, Austria, Romania, and Poland.
Readers can explore these global destination patterns in more detail here: https://www.migrationpolicy.org/programs/data-hub/charts/İmmigrant-and-emigrant-populations-country-origin-and-destination by selecting Greece as the country of origin.
7. Remittances to Greece
Annual remittance flows to Greece have increased over time. According to data from the Migration Policy Institute, remittances to Greece were relatively low in the early 1980s, totaling under $100 million annually.
Remittance inflows increased during the 1990s and early 2000s, reaching approximately $600 million by the late 1990s. By the late 2000s, remittances rose further to about $1.9 billion.
Remittance inflows declined in the early 2010s, followed by another increase beginning in the mid-2010s. By 2023, remittances to Greece reached approximately $3 billion, equivalent to about 1.3% of Greece’s GDP.
You can explore remittance trends in more detail here https://www.migrationpolicy.org/programs/data-hub/charts/remittance-trends-over-time?width=1000&height=850&iframe=true by selecting Greece as the country.
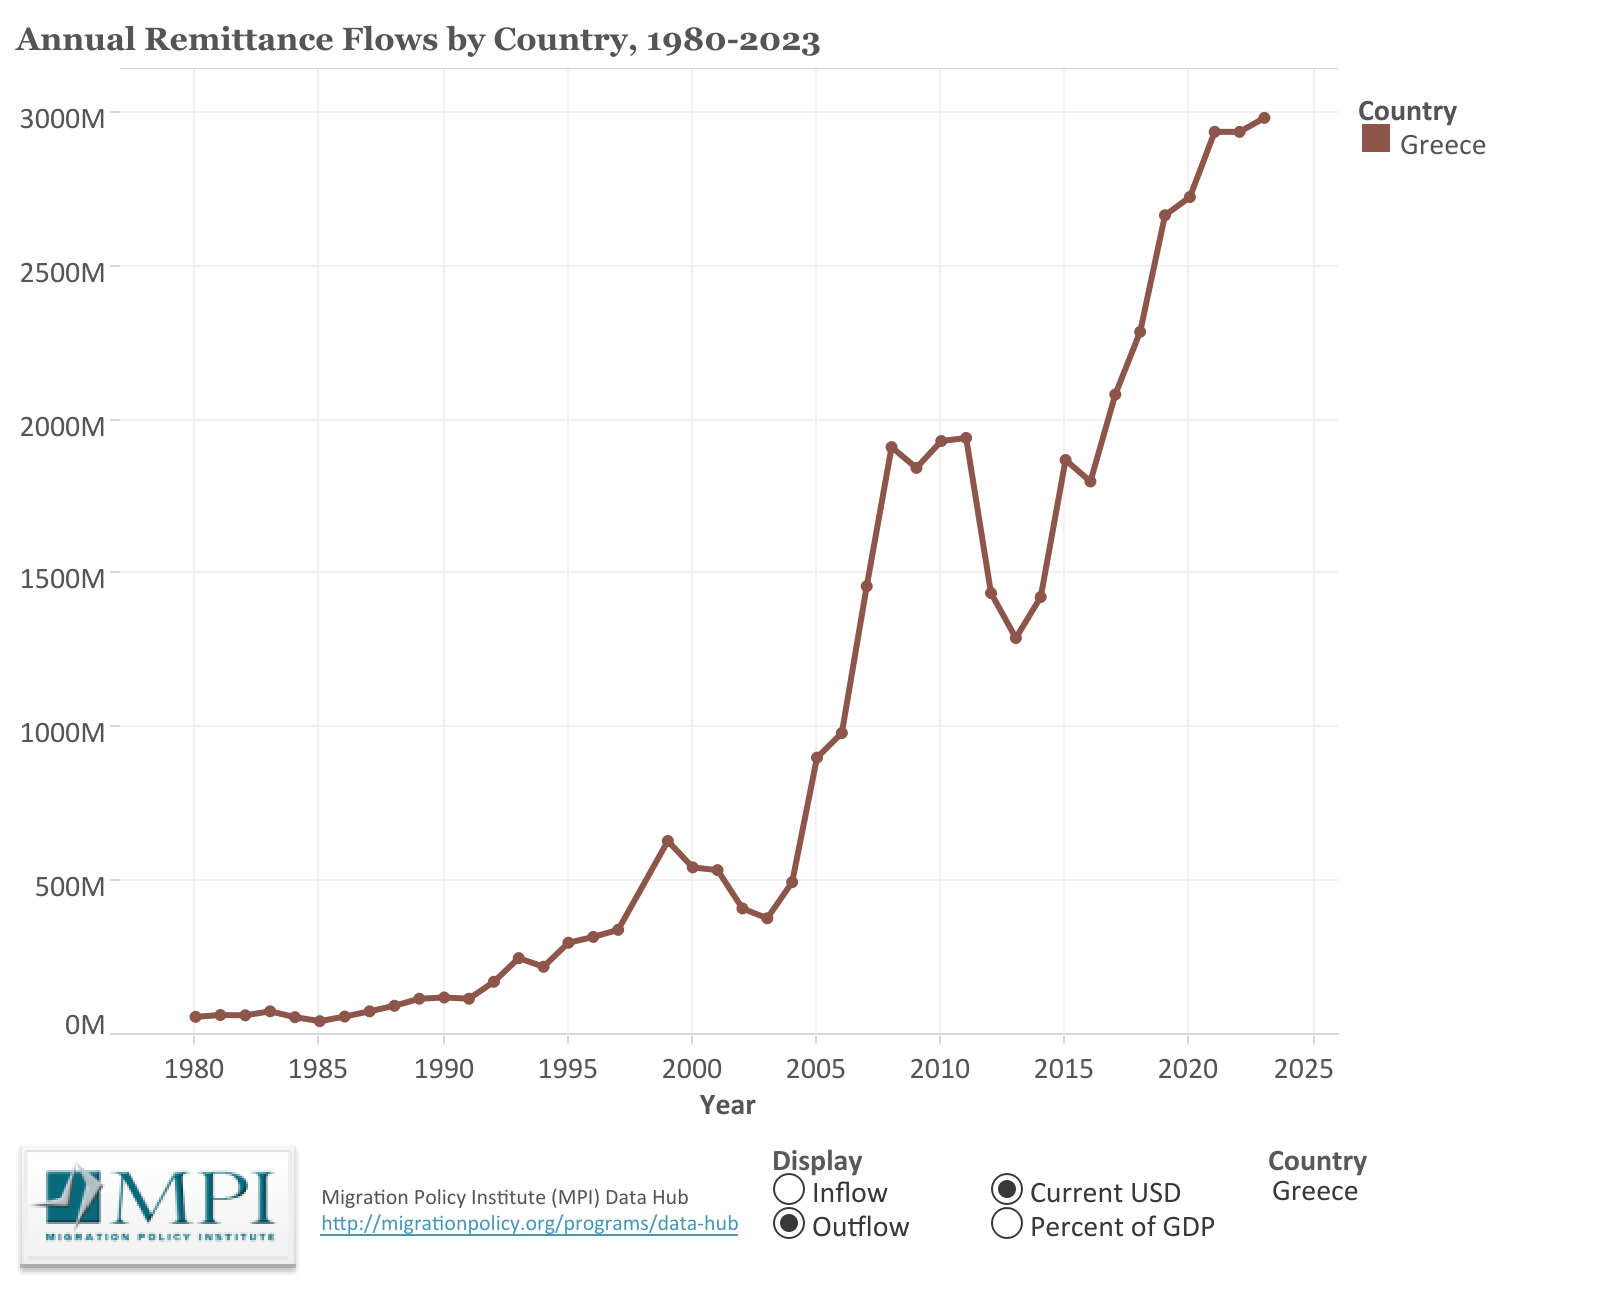
Figure 13: Annual Remittances Flows by Country (Greece), 1980-2023.
Source: Migration Policy Institute (MPI) Data Hub, Remittance Trends Over Time. Figure reproduced from the MPI Data Hub. Available at: https://www.migrationpolicy.org/programs/data-hub/charts/remittance-trends-over-time