A color-coded map of Massachusetts showing the share of Greek residents by county, with different shades indicating percentage ranges from 5% to 30%. The map highlights counties with higher Greek populations in yellow and others in darker shades of gray and blue.

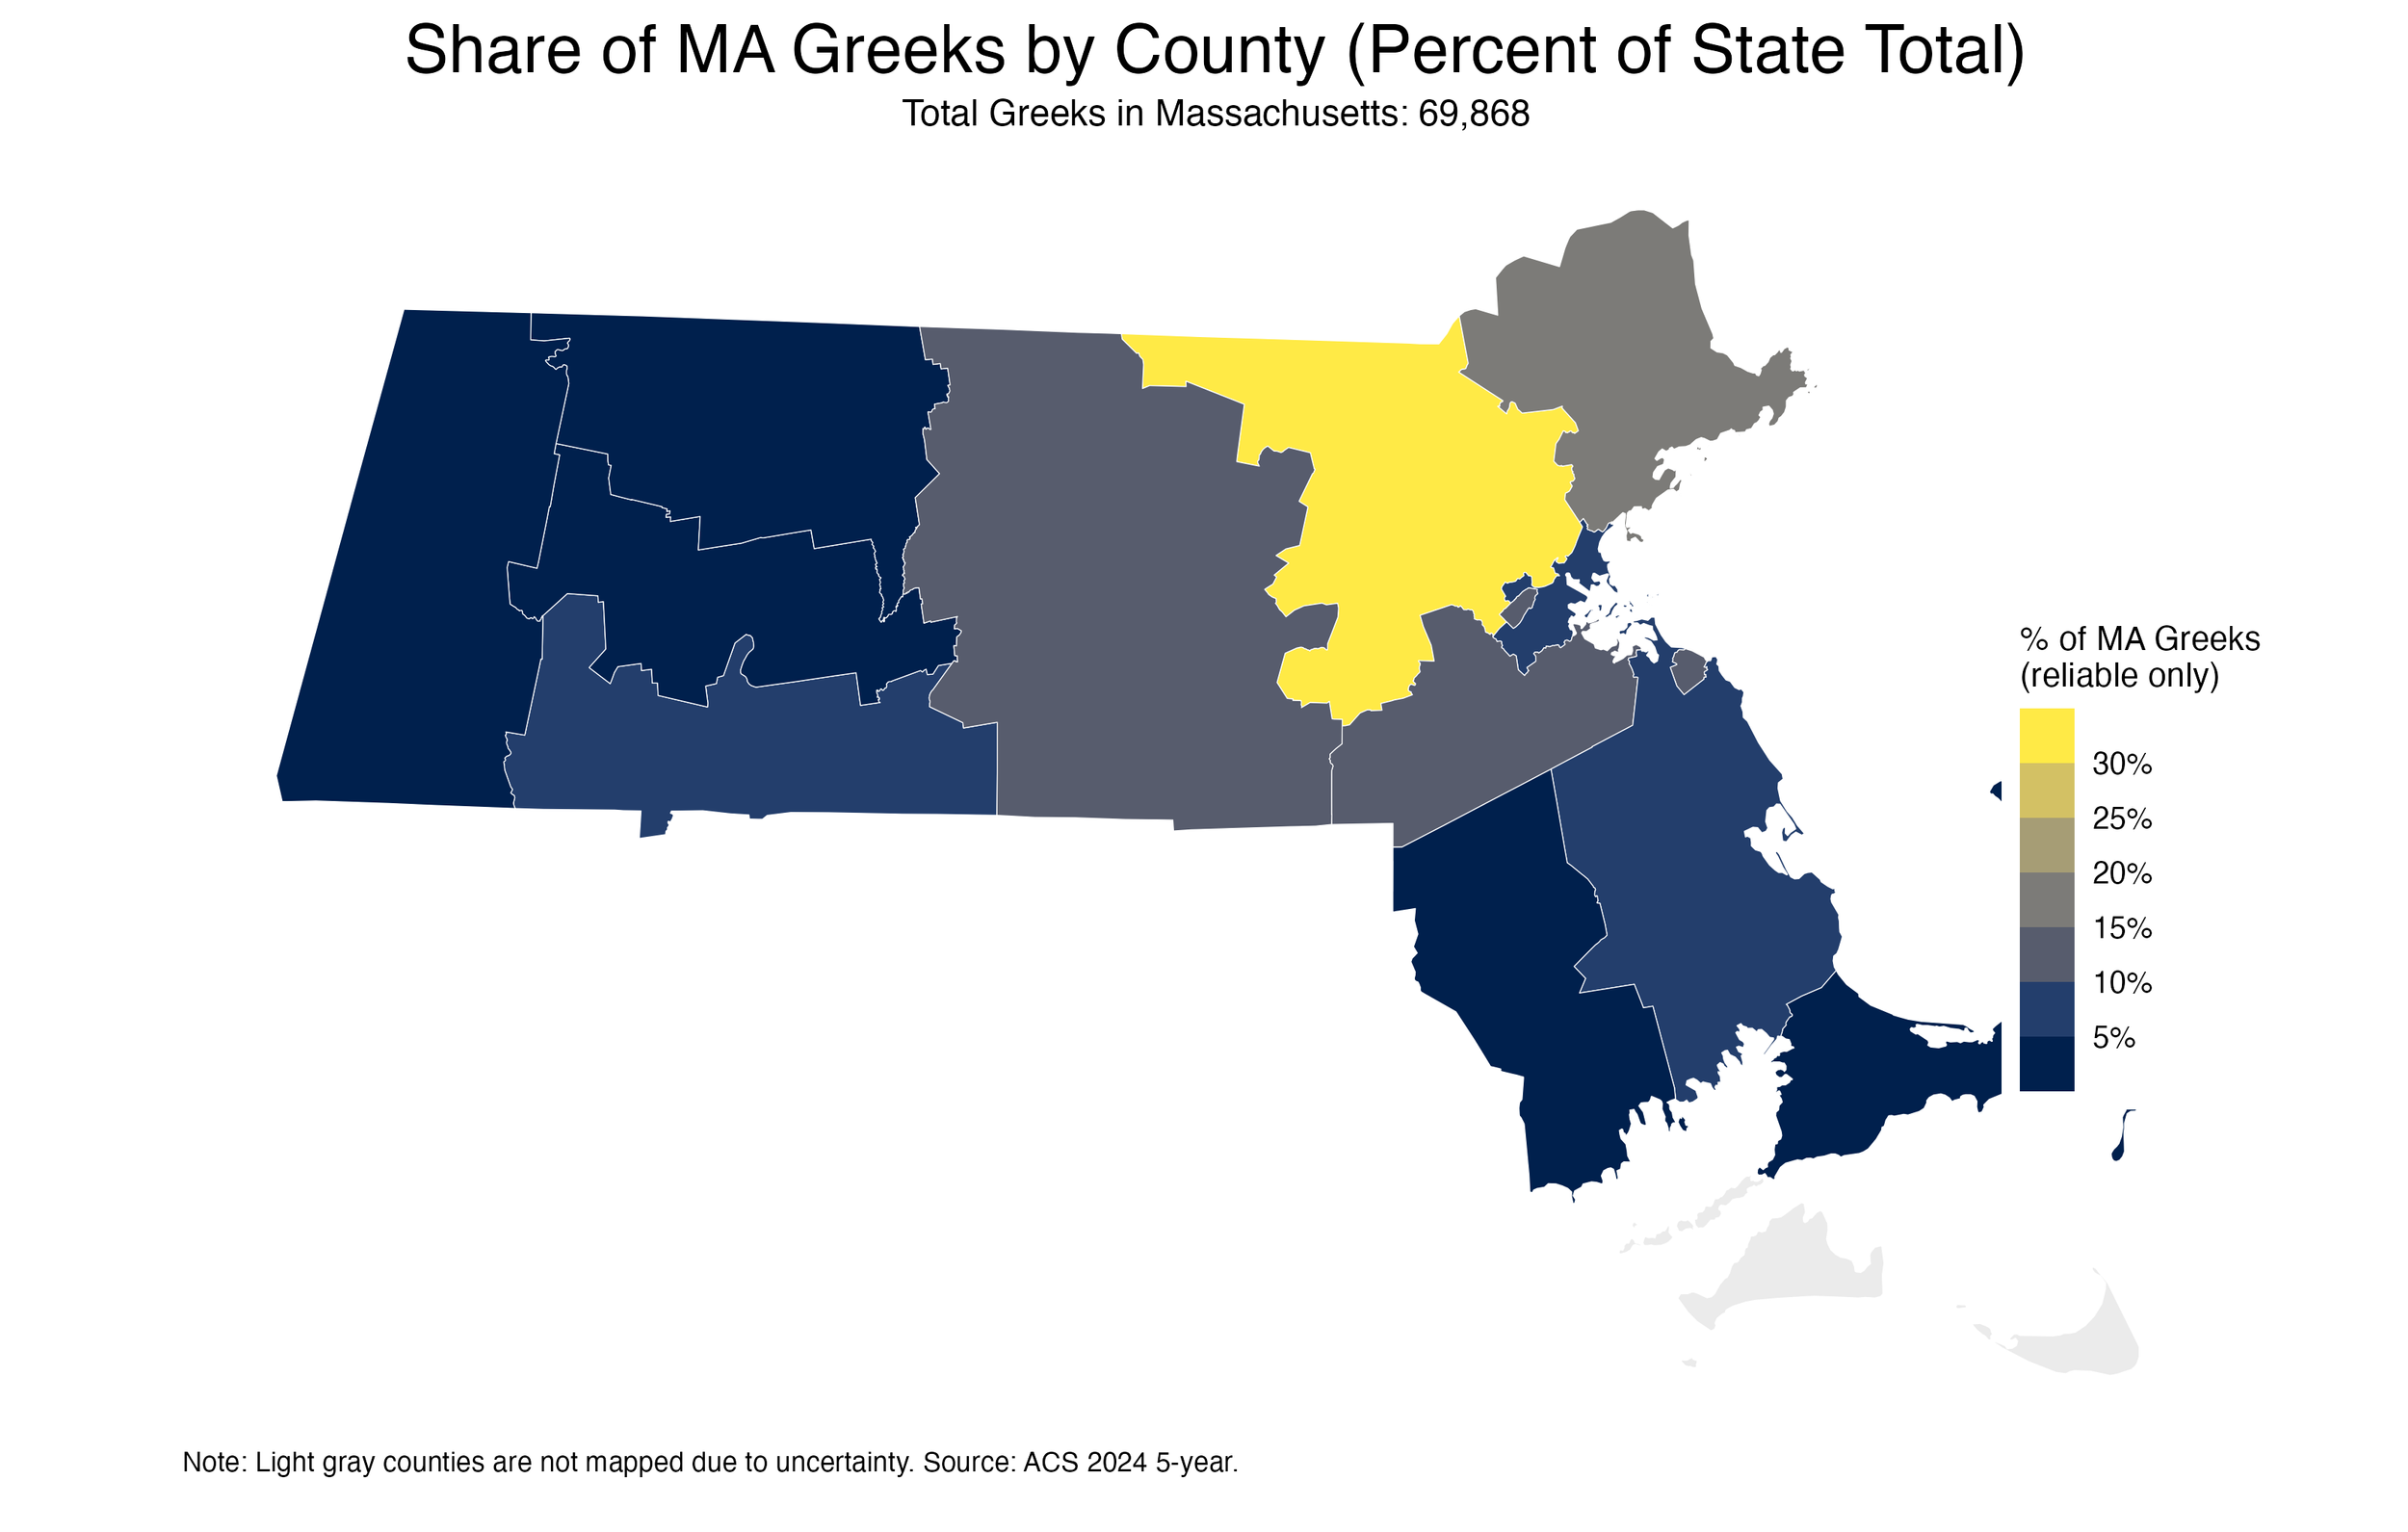
This table lists Greek ancestry estimates for each county and each county’s share of the state total.